United Insurance Company Limited (UNITEDINS) technical report
As of the 2026-11-01 close. Updated every trading day. Company page · All DSE stocks: technical data
In plain words
United Insurance traded mostly between ৳33 and ৳48 from 2023 into mid-2026. In July and early August 2026 the price rose quickly on very heavy trading, reaching ৳72.70 on 6 August. Since then it has drifted lower: through September it moved between about ৳58 and ৳65, and in early October it fell to ৳52.60. For the past two weeks it has been stuck in a narrow band, closing between about ৳54.90 and ৳56.70, and it ended 1 November at ৳55.80. It is now below its 50-day average (the average closing price of the last 50 trading days, ৳59.47), which has started to slope down, but well above its 200-day average (the average of the last 200 days, ৳49.17), which is still rising. The levels that matter are ৳52.60, the October low, and ৳59.00–59.50, the mid-October high and the 50-day average.
Key levels
Support is a price where buying has tended to stop declines; resistance is where selling has stopped rallies. Here, ৳52.60 held in October and ৳54.00 held in late October. Above, ৳59.00 capped the mid-October bounce, and ৳64.80–65.40 stopped two September rallies. The 200-day average near ৳49.17 is the deeper reference.
Trend on each timeframe
The monthly chart still shows an uptrend: the summer breakout lifted price well above its old range and its 12-month average. The weekly chart shows that breakout being retraced, with lower highs and MACD below its signal. The daily and hourly charts are flat, so the shorter views show a pause inside a larger pullback.
Monthly Up
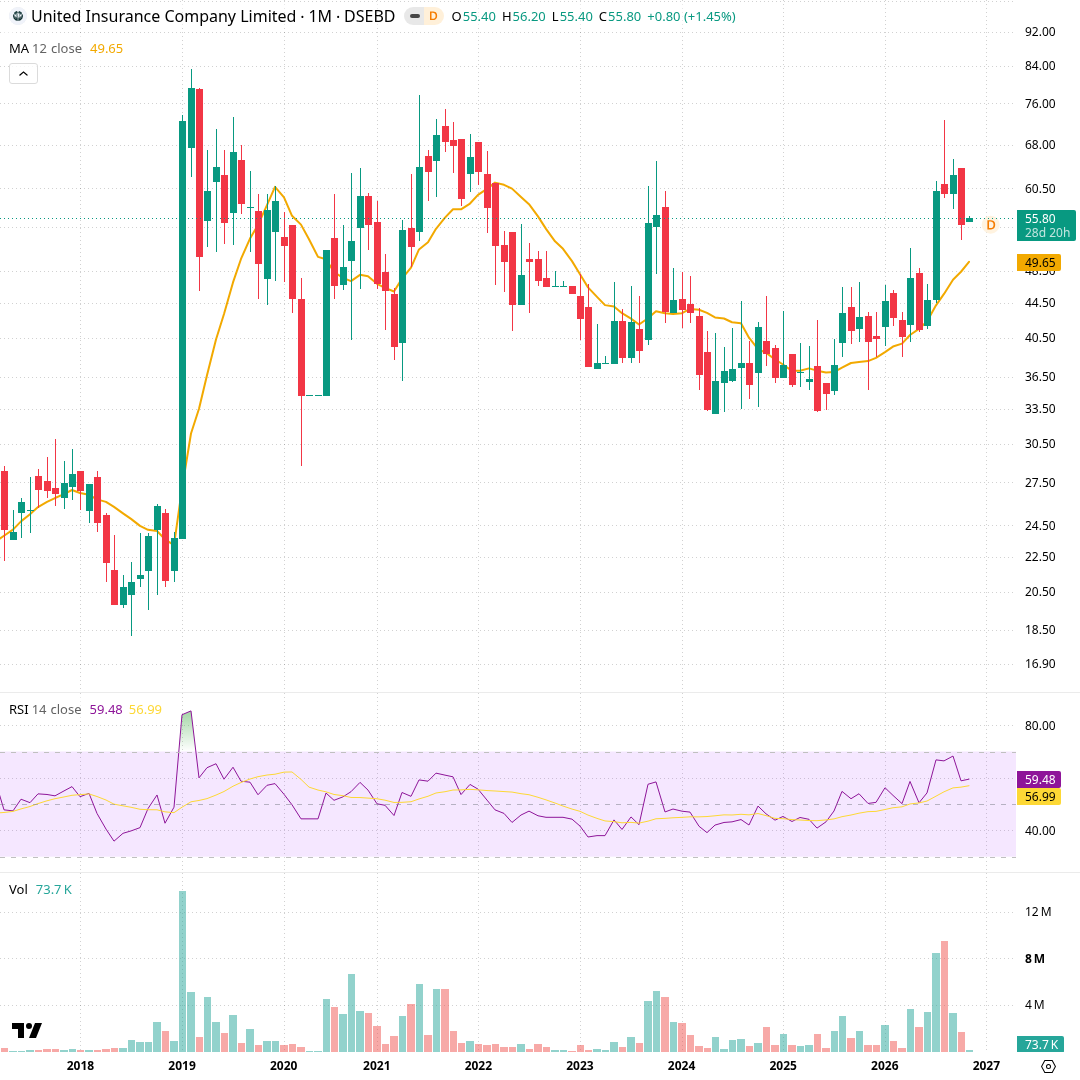
Each candle is one month, covering about ten years. The orange line is the 12-month simple average, now ৳49.65 and rising; the middle panel is RSI, a 0–100 momentum gauge, at 59.5; the bottom panel is monthly volume. From 2023 to mid-2026 price moved mostly between ৳33 and ৳48. In July and August 2026 it broke higher on the largest monthly volume since 2019, peaking at ৳72.70. September and October gave back part of that move, and November opened at ৳55.80.
Weekly Down
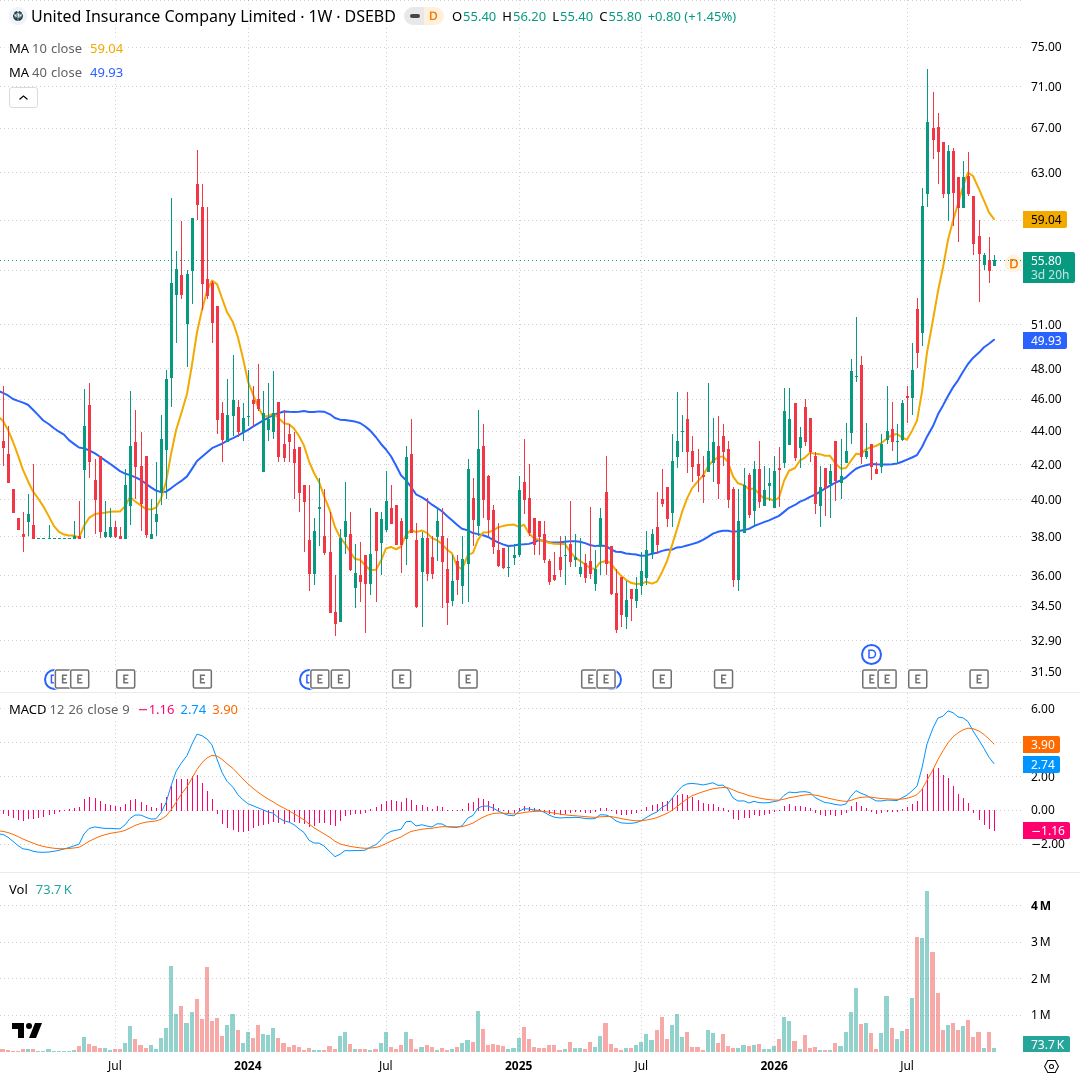
Each candle is one week, about four years in all. The orange line is the 10-week average (৳59.04) and the blue line the 40-week average (৳49.93). The MACD panel tracks momentum from two averages; the MACD line at 2.74 sits below its 3.90 signal line, with a histogram of -1.16 that has been negative since early September. Price spiked from about ৳48 to ৳72.70 in late July and early August on volume above 3 million shares a week, then made lower weekly highs through October. It now trades below the 10-week line but well above the 40-week line.
Daily Sideways
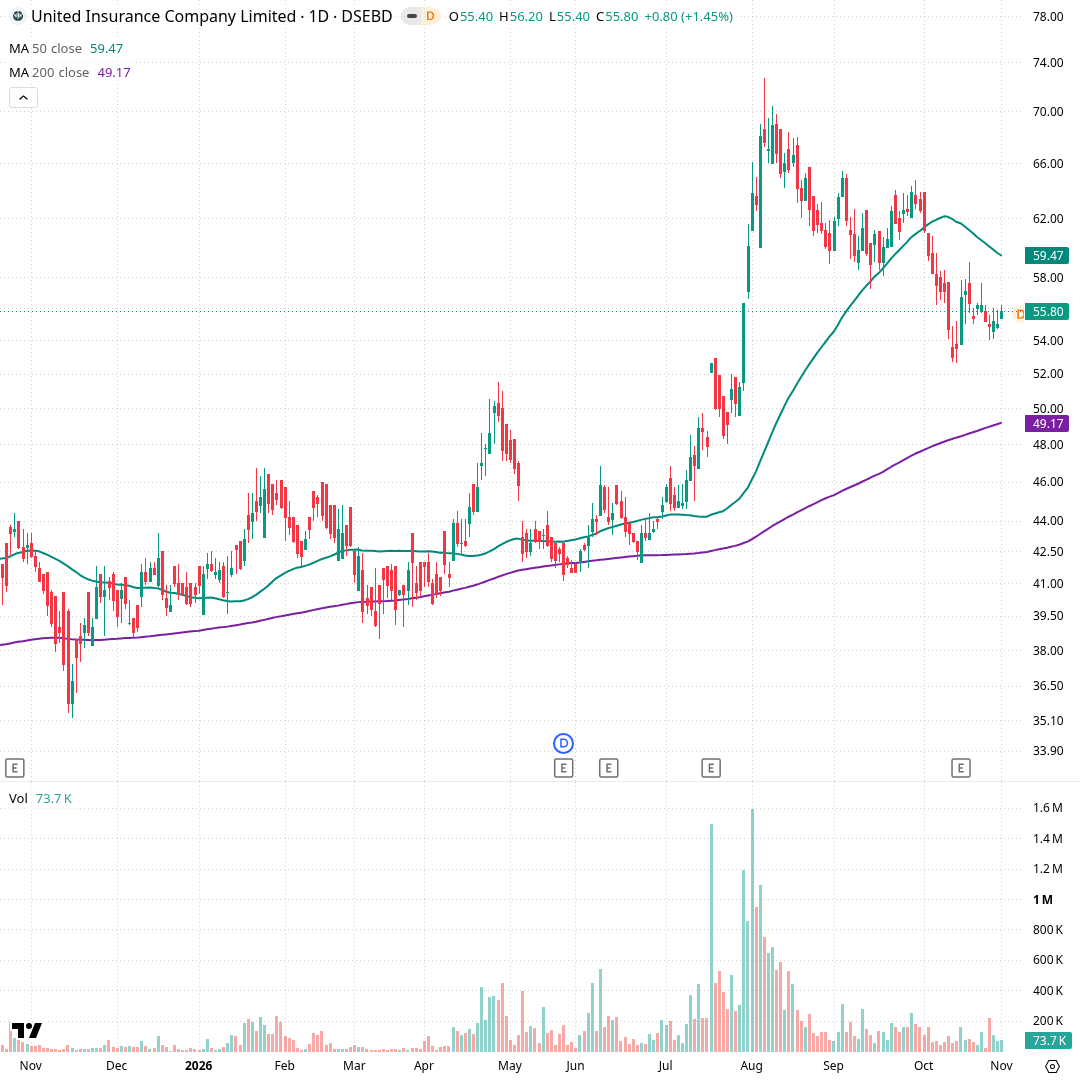
Each candle is one trading day, about a year. The green line is the 50-day average (৳59.47), the average close of the last 50 sessions, and the purple line the 200-day average (৳49.17). Price rose from ৳35.20 in November 2025 to ৳72.70 on 6 August 2026, with daily volume peaking at 1.59 million shares. It then slipped through a ৳58–65 zone in September, broke lower in early October to ৳52.60, and has since closed between ৳53.00 and ৳57.10. The 1 November close was ৳55.80 on 73,696 shares.
Hourly Sideways
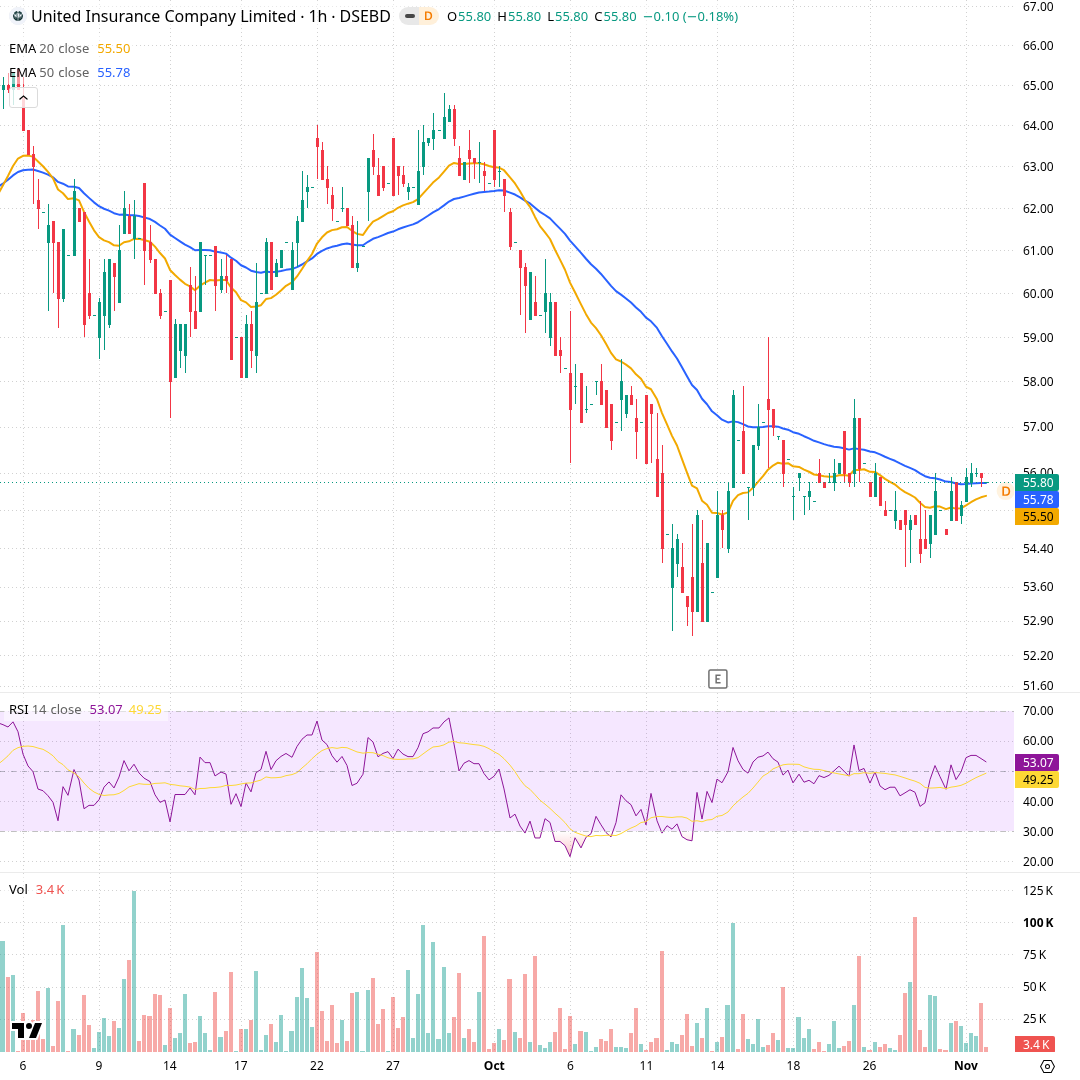
Each candle is one trading hour across about two months. The orange and blue lines are 20- and 50-hour exponential averages, which weight recent prices more (৳55.50 and ৳55.78). Late September saw a ৳60–64.8 range, then a slide in early October to ৳52.60. Since mid-October hourly price has stayed between about ৳54.00 and ৳59.00, and in the last week between ৳54.00 and ৳56.30, with both averages flattening. Hourly RSI reads 53.1, close to the middle of its scale.
Momentum and volume
Momentum is quiet. RSI at 44.2 is a little below the midpoint, after recovering from near 30 in mid-October. MACD is flat just below zero, and ADX at 14.7 says there is no strong trend in either direction. Trading volume is below its recent average and far lower than during the August surge, so interest has faded.
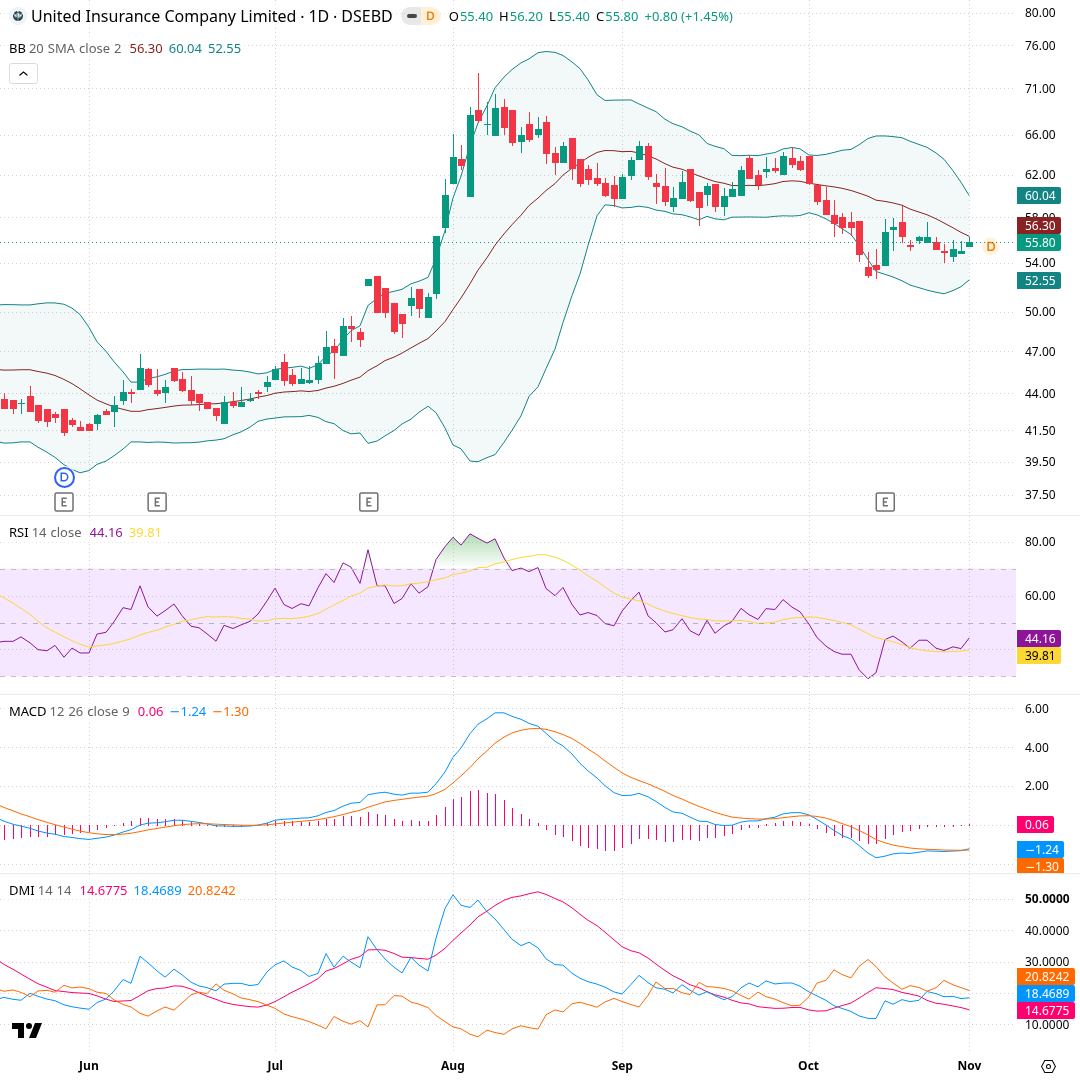
Each candle is one trading day across about six months. Bollinger Bands form a channel two standard deviations around the 20-day average; they now run from ৳52.55 to ৳60.04 with a ৳56.30 midline, and have narrowed since August. Price closed at ৳55.80, just under the midline. RSI, a 0–100 momentum gauge, is 44.2, up from near 30 in mid-October. MACD (-1.24) is barely above its signal (-1.30). In the DMI panel, ADX, the trend-strength line, is 14.7, a weak reading, with -DI at 20.8 just over +DI at 18.5.
What would change the picture
Each scenario card names a price and what a daily close beyond it would mean for the chart's shape. They are conditions to watch, not predictions; the cards do not say which one will happen, and the price may stay between them for some time.
Recent changes and what followed
Each row is a day a tracked signal changed, and the price move over the next 5, 20 and 60 trading days (blank until that many days have passed). Past moves do not predict future ones.
| Date | Change | Close | Next 5 days | Next 20 days | Next 60 days |
|---|---|---|---|---|---|
| 2026-11-01 | MACD crossed above its signal line | ৳55.80 |
- Computed from daily closing prices (method t1, wording agent-2); history kept from 2026-11-01.
- Describes price history only. Not investment advice, not a rating or a price target.