United Commercial Bank PLC (UCB) technical report
As of the 2026-11-01 close. Updated every trading day. Company page · All DSE stocks: technical data
In plain words
United Commercial Bank's share price has been drifting lower for most of 2026. It peaked at ৳10.80 in February and slid to ৳7.80 on October 8, its lowest level in a year. In late October buyers stepped in: on October 29 the price jumped from ৳8.40 to ৳9.20 on almost 3 million shares, many times the normal daily amount. The next day it reached ৳9.60 but could not last there, and today it closed at ৳8.80. That puts it just under the 50-day average (the average closing price of the last 50 trading days, ৳8.86) and below the 200-day average (the average of the last 200 trading days, ৳9.31), which is still sloping down. The levels that matter now are ৳9.31-৳9.60 above, where the rebound was turned back, and ৳8.40 and ৳7.80 below, the late-October and early-October lows.
Key levels
Support is a price where buying has stopped falls before; resistance is where selling has stopped rises. On UCB, ৳7.80 held as the October floor and ৳8.40-৳8.50 was the base before the jump. Above, the rally stalled at ৳9.60 near the 200-day average, and ৳10.80 is the year's high.
Trend on each timeframe
The monthly and weekly charts still show a downtrend: lower highs since 2024 and price under the 12-month and 40-week averages. The daily chart has turned sideways after the October low, and the hourly chart is rising. So the short-term rebound is pushing against a longer-term decline that has not reversed.
Monthly Down
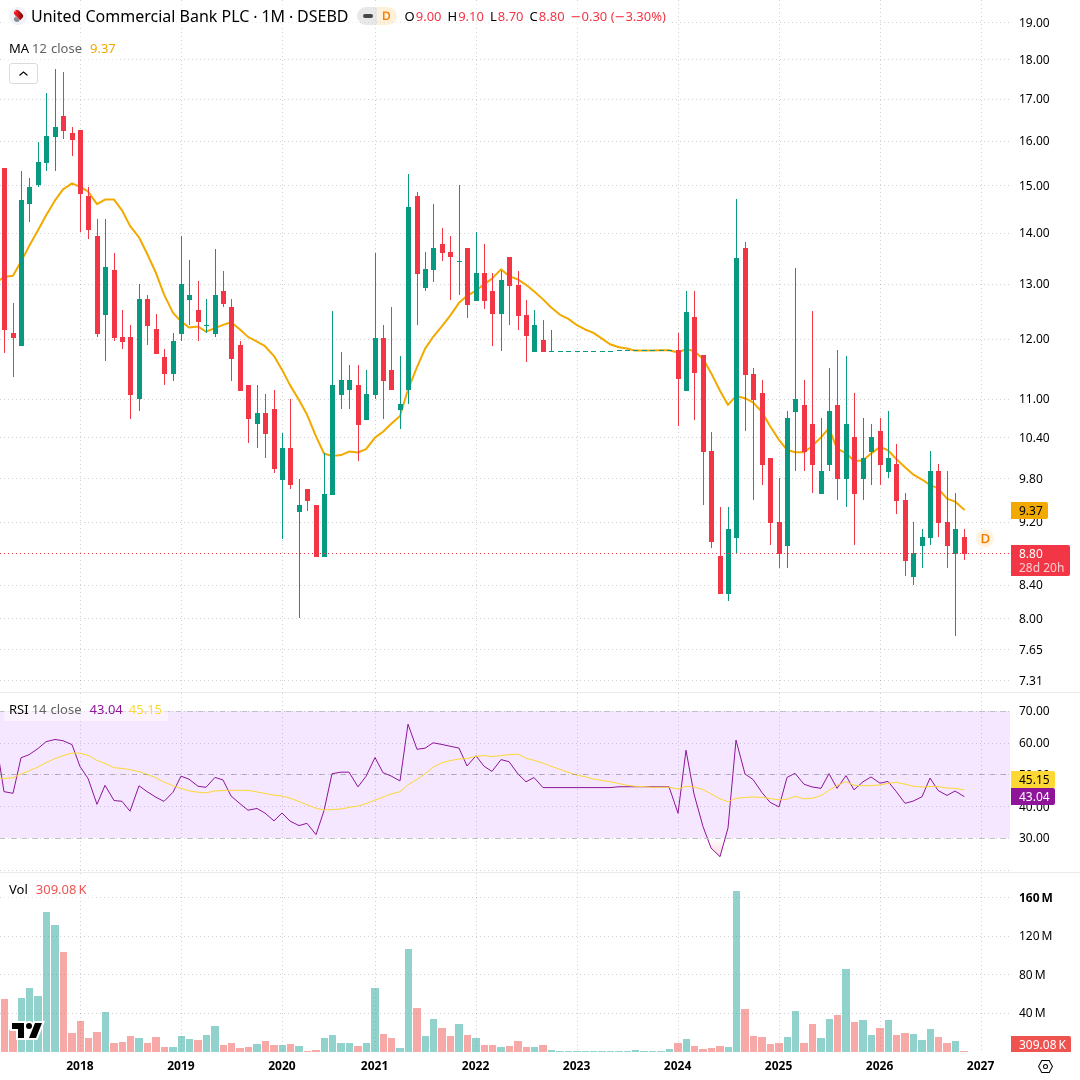
Each candle is one month, covering about ten years. The orange line is the 12-month simple average, the average closing price of the last 12 months (৳9.37). The lower panel is RSI, a 0 to 100 momentum gauge (43.04), and the bottom panel is volume. After the 2024 spike towards ৳14.70, monthly highs have stepped lower. Price has stayed below the 12-month line for most of 2026. In October it dipped to ৳7.80 before recovering, and November opened at ৳9.00 and is at ৳8.80.
Weekly Down
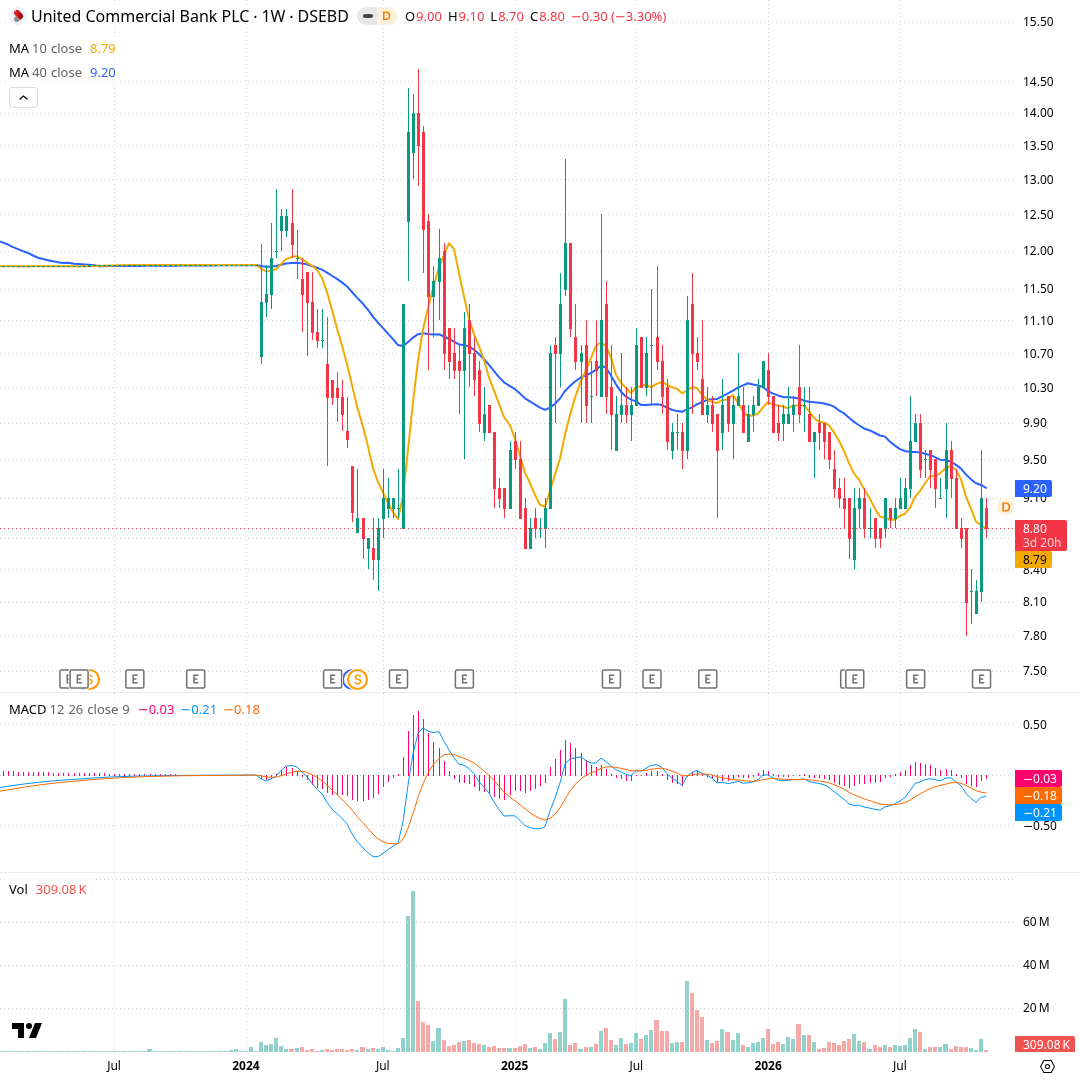
Each candle is one week. The orange line is the 10-week average (৳8.79) and the blue line the 40-week average (৳9.20), roughly the average price of the last 10 and 40 weeks. The middle panel is MACD, which compares a fast and a slow average to show momentum; it reads -0.21 against a -0.18 signal line. The 40-week line has sloped down through 2026. Last week the stock rose from ৳8.20 to ৳9.10 on 5.43M shares, with a high of ৳9.60, after three weeks with lows near ৳7.80-৳8.00.
Daily Sideways
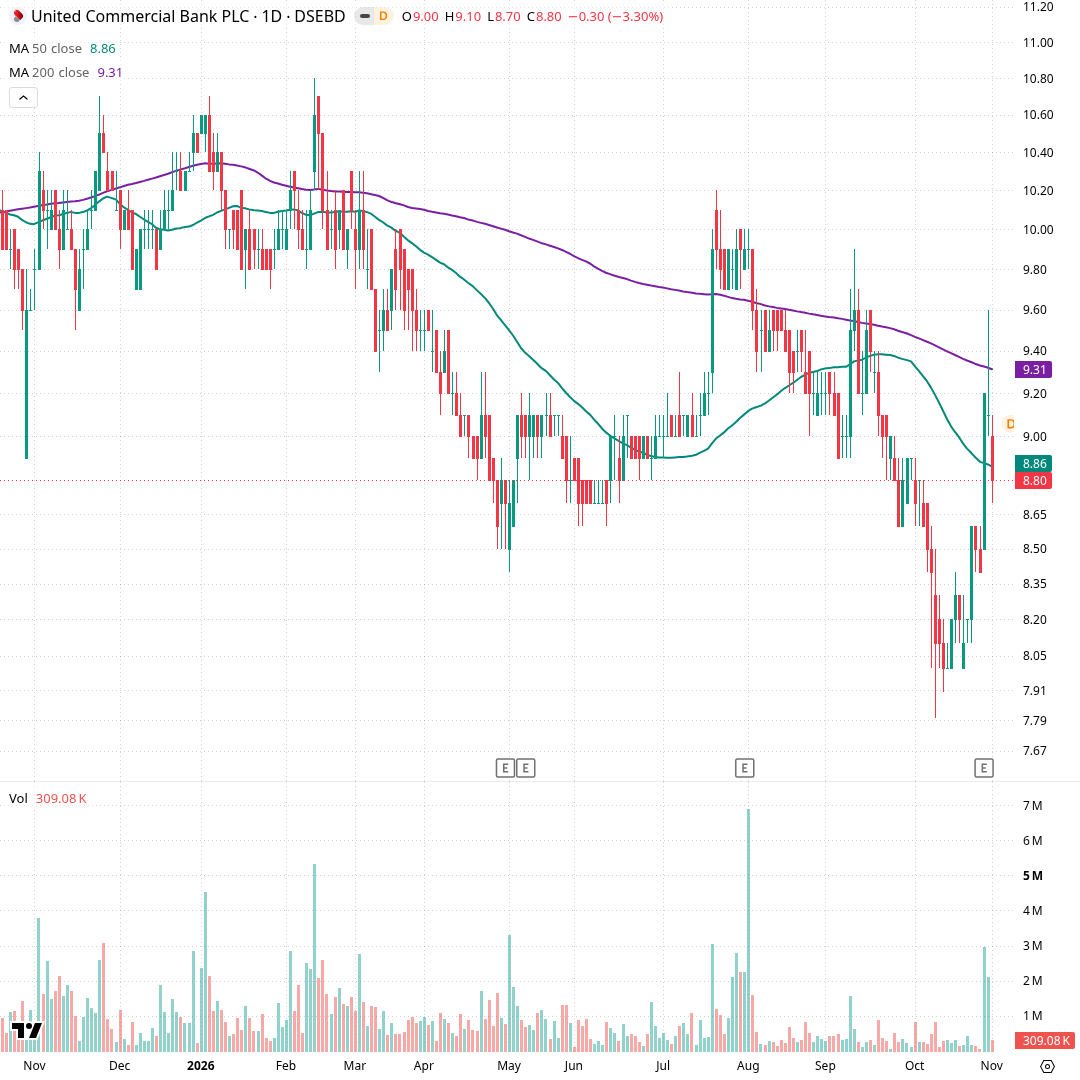
Each candle is one trading day, covering about a year. The green line is the 50-day average (৳8.86) and the purple line the 200-day average (৳9.31). Price slid from ৳10.80 in February to a ৳7.80 low on October 8. On October 29 it jumped 9.5% to ৳9.20 on 2.95M shares, far above normal volume. The next day it touched ৳9.60 near the 200-day line and then pulled back. Today it closed at ৳8.80 on light volume of 309K shares.
Hourly Up
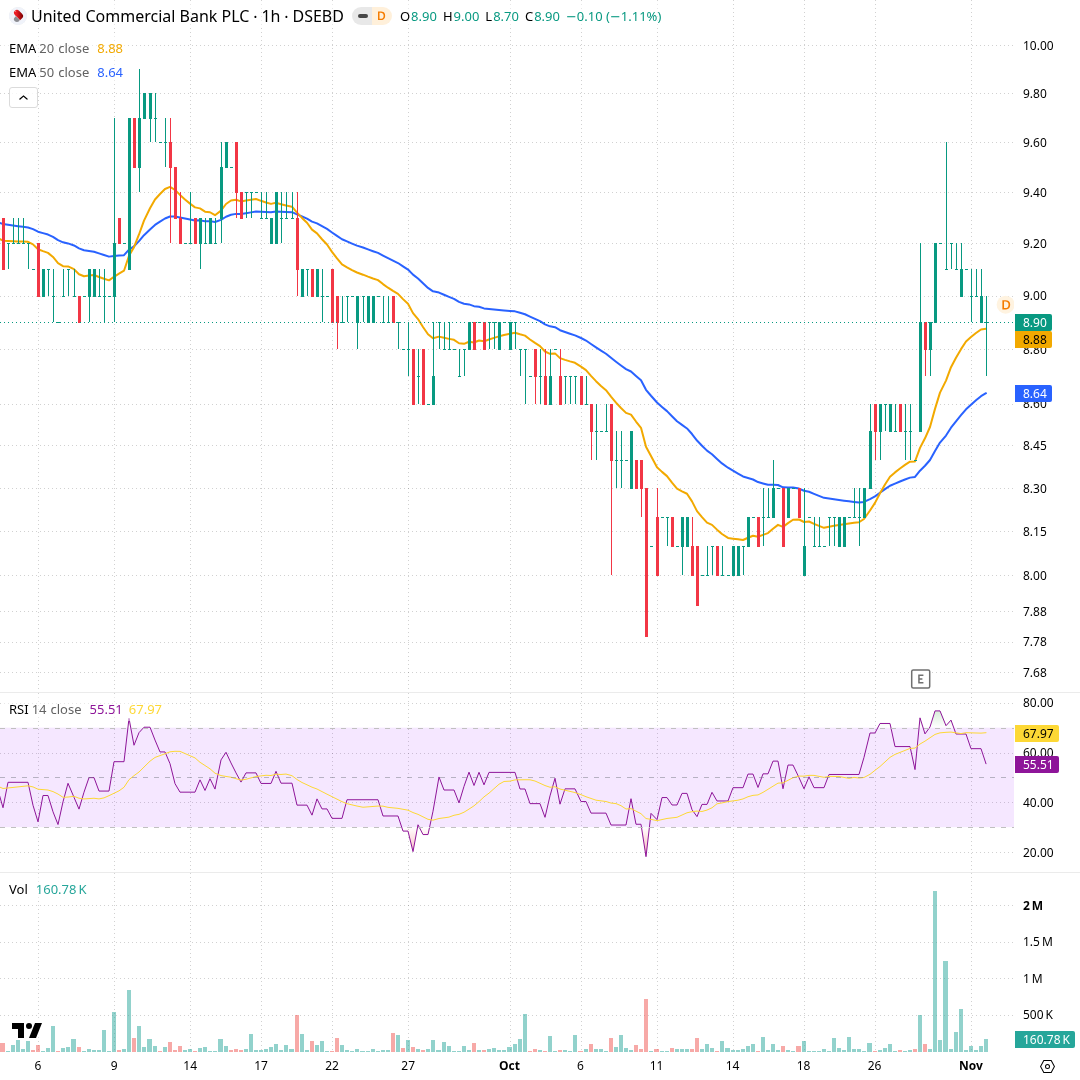
Each candle is one trading hour, covering about two months. The orange and blue lines are the 20 and 50-hour exponential averages, which give more weight to recent prices (৳8.88 and ৳8.64). The lower panels are RSI and volume. Through September and early October prices drifted down to the ৳7.80 low. In late October price crossed above both lines, and volume spiked as it reached ৳9.60. The last bars eased back to ৳8.90 at the 20-hour line, with RSI at 55.51.
Momentum and volume
Momentum has improved from very weak levels. RSI recovered from near 30 to 53, a neutral reading, and MACD crossed above its signal line. Buying volume was heavy on October 29-30 but faded to about half the average today, as price slipped back from the high.
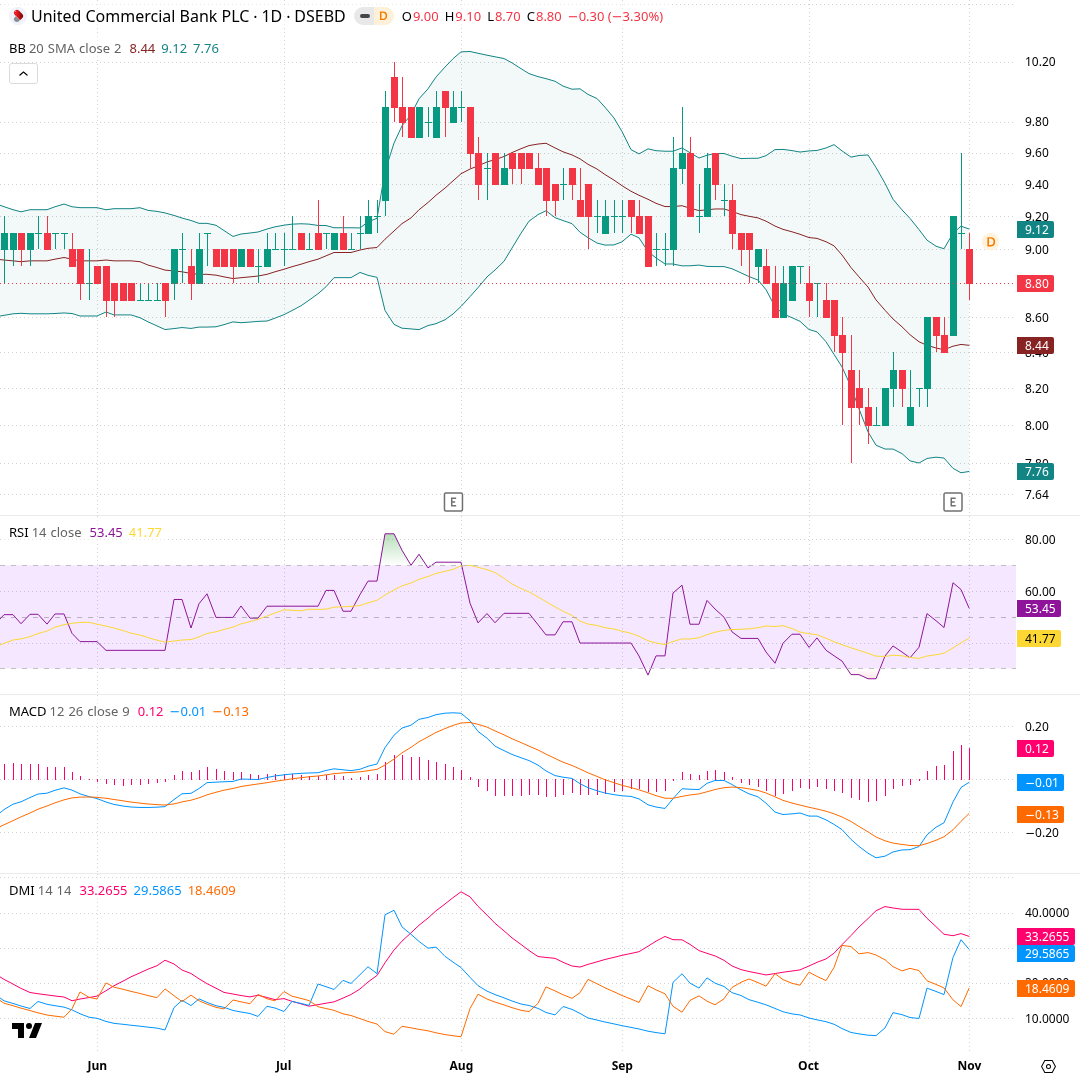
Each candle is one day over about six months. The shaded band is Bollinger Bands, a 20-day average (৳8.44) with lines two standard deviations above (৳9.12) and below (৳7.76), showing how far price usually strays. Panels below show RSI (53.45), MACD (-0.01 vs signal -0.13) and ADX/DMI, which measures trend strength. Price hugged the lower band through early October, then pushed up to the upper band on October 29-30. MACD crossed above its signal line and ADX is 33.27 with +DI above -DI.
What would change the picture
The scenario cards are conditions to watch, not predictions. Each one says what a daily close past a certain price would mean for the chart's structure. None of them says that it will happen.
Recent changes and what followed
Each row is a day a tracked signal changed, and the price move over the next 5, 20 and 60 trading days (blank until that many days have passed). Past moves do not predict future ones.
| Date | Change | Close | Next 5 days | Next 20 days | Next 60 days |
|---|---|---|---|---|---|
| 2026-11-01 | Closed below the nearest support level | ৳8.80 | |||
| 2026-10-29 | Volume three times or more its 20-day average | ৳9.10 |
- Computed from daily closing prices (method t1, wording agent-2); history kept from 2026-10-29.
- Describes price history only. Not investment advice, not a rating or a price target.