Tamijuddin Textile Mills PLC (TAMIJTEX) technical report
As of the 2026-11-01 close. Updated every trading day. Company page · All DSE stocks: technical data
In plain words
Tamijuddin Textile closed at ৳102.6 on 1 November 2026, down 1.82% on the day. Over the summer the share climbed from about ৳115 in May to a 52-week high of ৳144.0 in July, then turned lower. Since August it has made a series of lower highs and lower lows, meaning each bounce has stopped below the last one and each dip has gone further. It is now 28.8% below the July peak and only just above its 52-week low of ৳101.2, set on 26 October. The price is under its 50-day average (৳114.80, the average closing price of the last 50 trading days) and its 200-day average (৳121.13, the same idea over about ten months). Being below both shows that recent prices are weaker than the longer-run norm. The levels that matter most now are ৳101.2 underneath and the ৳107-111 zone above, where short rebounds in late October stalled.
Key levels
Support is a price where buying has stopped falls before; resistance is where rallies have stalled. For this stock, ৳101.2-101.5 has held twice, in November 2025 and October 2026. Above, ৳107.0 capped last week, ৳110.8-111.3 capped mid-October, and ৳116-117 stopped the October rebounds. The old August floor at ৳128.4-129.0 turned into resistance after it broke.
Trend on each timeframe
All four views point the same way. The monthly chart has slipped below its 12-month average after four red months. The weekly 10-week average has crossed under the 40-week. On the daily chart price is under both the 50-day and 200-day, and the hourly averages slope down. The only difference is degree: the hourly decline is shallow while the daily RSI is already oversold.
Monthly Down
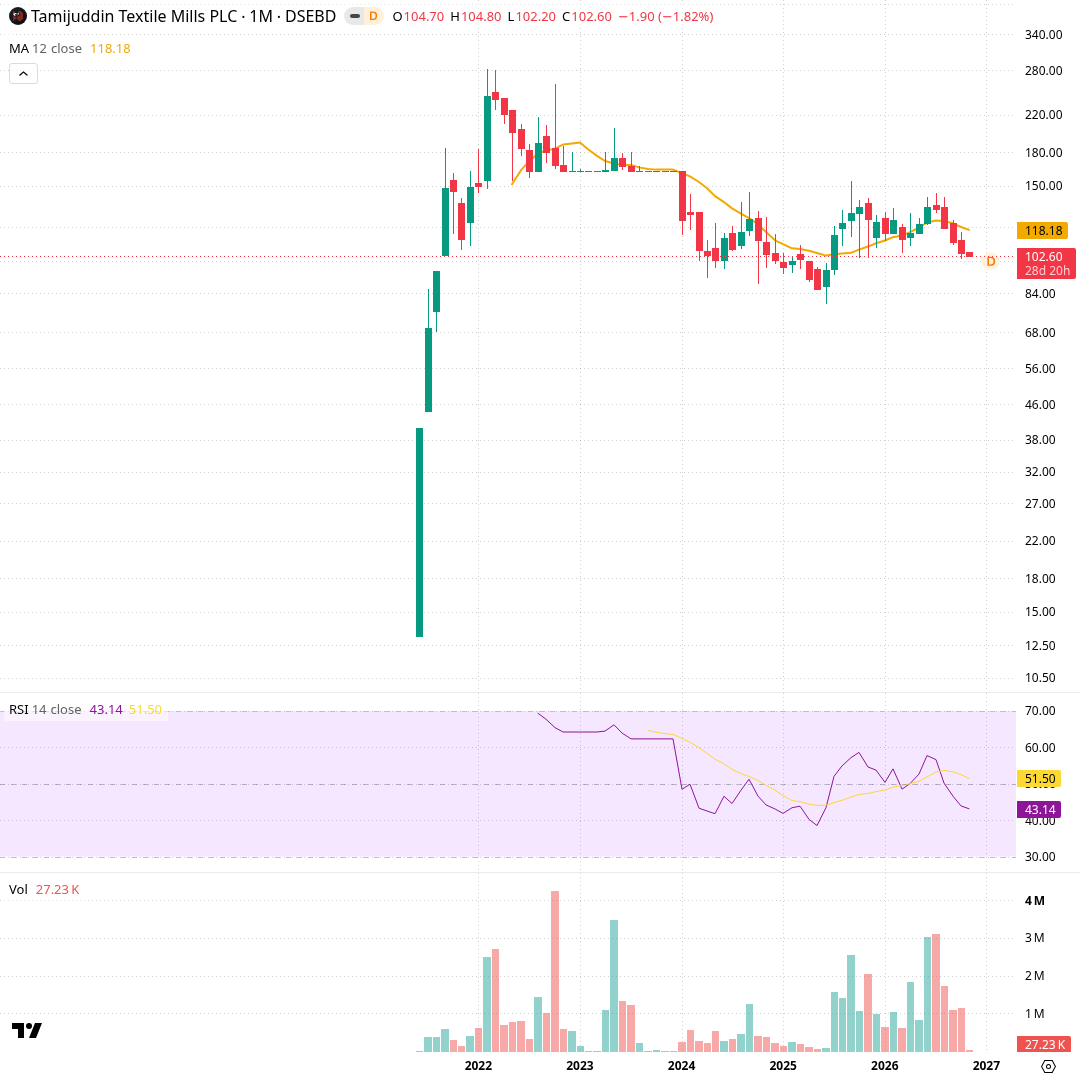
Each candle is one month, covering the stock since its 2021 listing run. The orange line is the 12-month simple average (৳118.18), the average close of the last year. The lower panels show RSI, a 0-100 momentum gauge, now 43.14, and monthly volume. After peaking near ৳280 in 2022 the stock fell into a 2024-25 base, recovered to the ৳140s in 2025-26, and has now posted four red months to ৳102.6, back under the yearly average.
Weekly Down
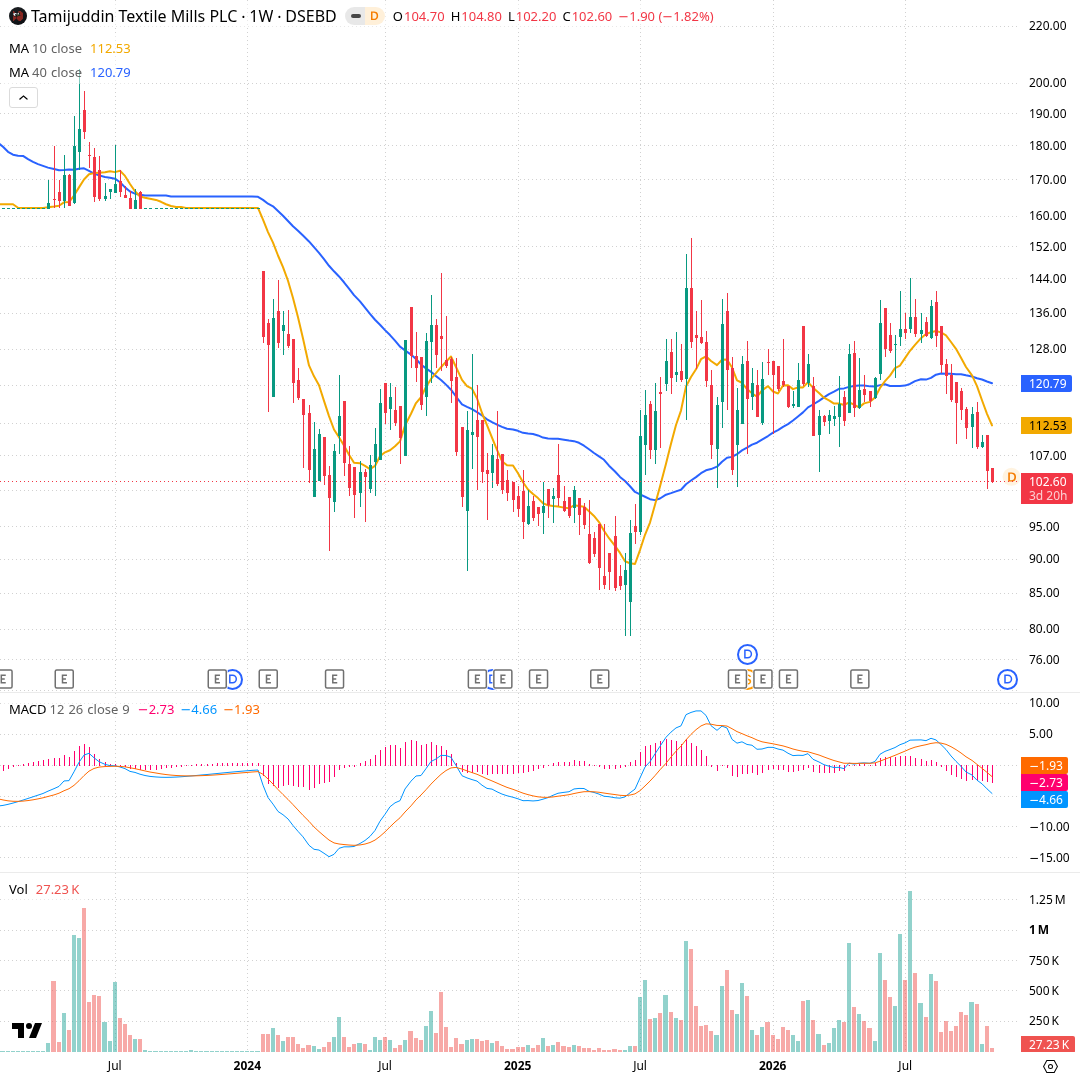
Each candle is one week. The orange line is the 10-week average (৳112.53) and the blue line the 40-week average (৳120.79), roughly the last ten months. Below are MACD, which compares a fast and slow average to show momentum (MACD -4.66 vs signal -1.93), and weekly volume. Price ranged ৳120-144 through mid-2026, then broke down from August; the week of 26 October set a low of ৳101.2 and this week trades ৳102.2-104.8.
Daily Down
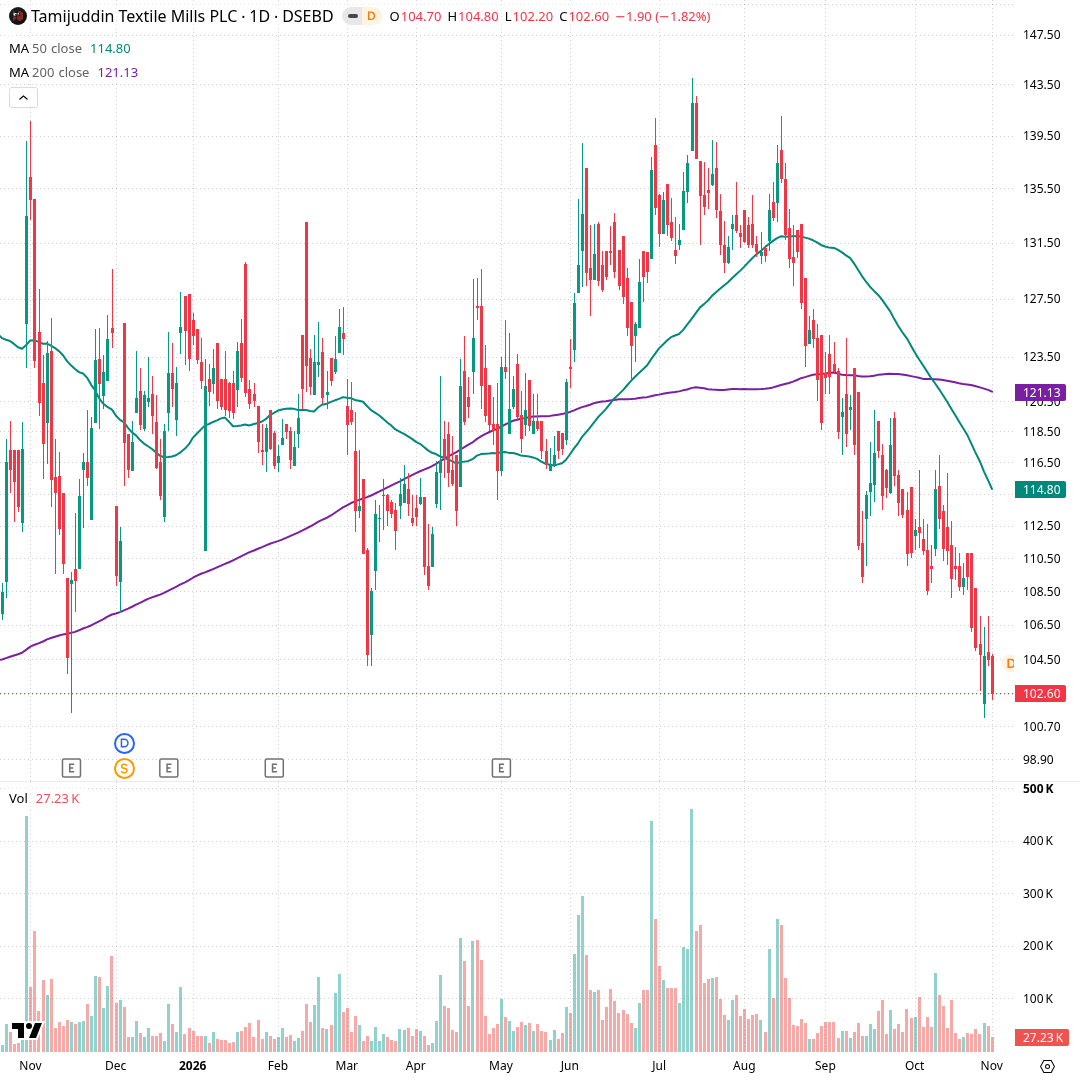
Each candle is one trading day over about a year. The green line is the 50-day average (৳114.80) and the purple line the 200-day average (৳121.13), the average close of the last 200 sessions. The lower panel is daily volume. Price rallied from ৳104.1 in March to ৳144.0 in July on volume spikes above 400K, then fell steadily, losing the 200-day in early September. The latest session closed at ৳102.6 on 27,233 shares, well below the recent average.
Hourly Down
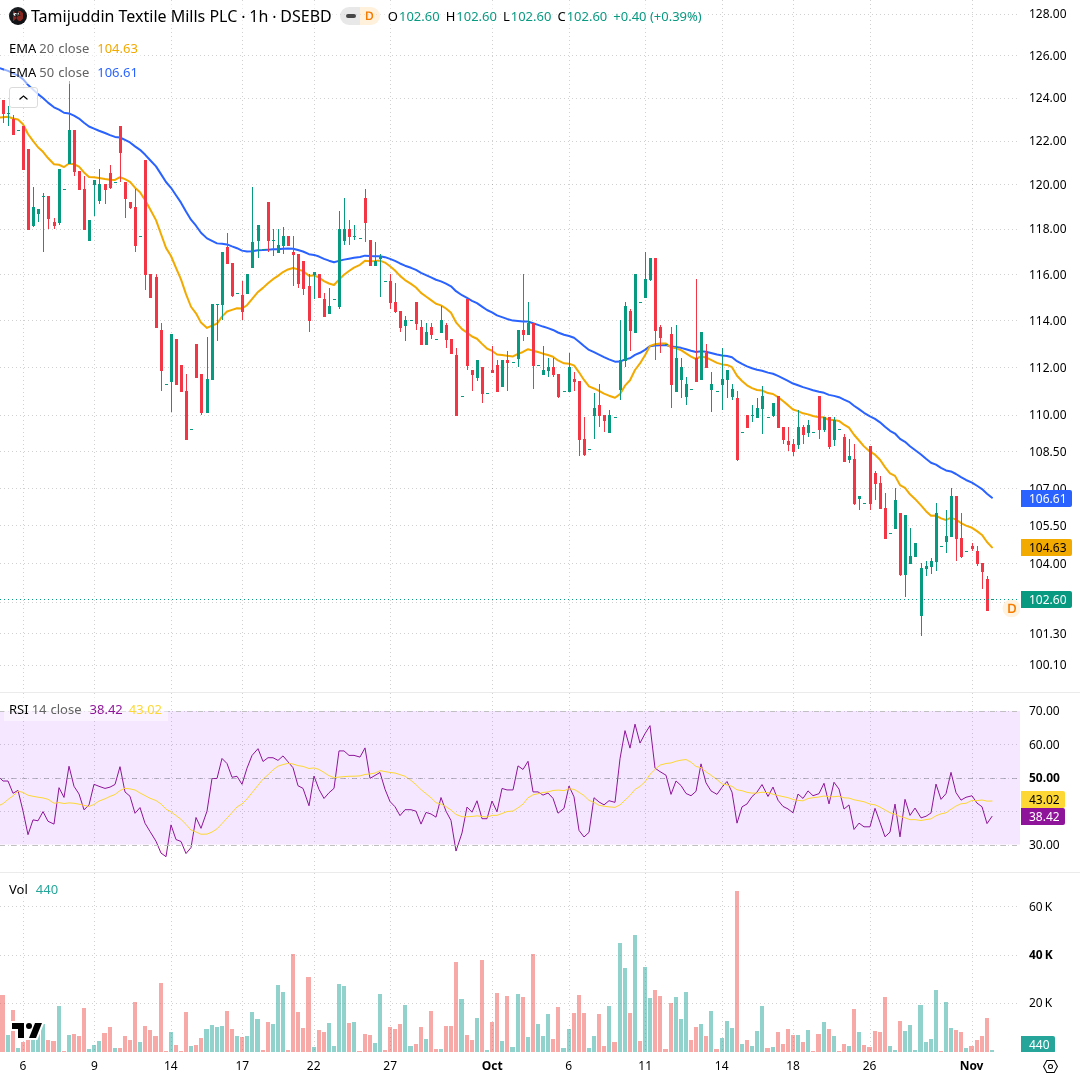
Each candle is one trading hour, covering early September to now. The orange line is the 20-hour exponential average (৳104.63), which weights recent prices more, and the blue line the 50-hour (৳106.61). Below are RSI (38.42) and hourly volume. Price has stayed mostly under both averages since mid-September, stepping down from about ৳120 to ৳102.6; brief rebounds in mid-October and late October stalled at the 50-hour line.
Momentum and volume
Selling pressure has been steady but quiet. RSI at 28.3 is in the oversold zone, meaning the recent drop has been large relative to recent gains. MACD stays below its signal line, and ADX at 15.5 shows the trend is not strong. Volume is about half its usual level, so the slide is happening without heavy trading.
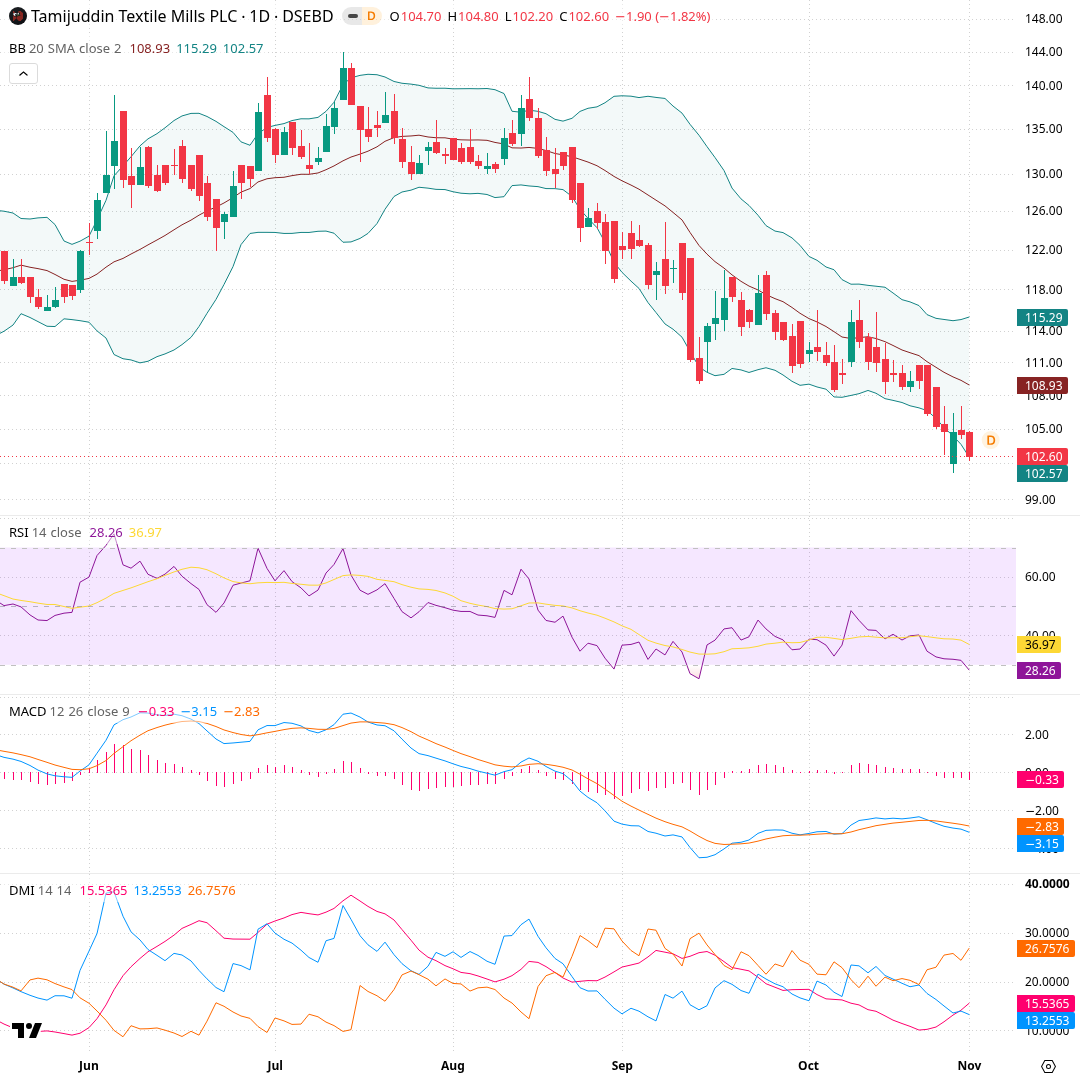
Each candle is one day from late May to now. The shaded channel is Bollinger Bands: a 20-day average (৳108.93) with bands two standard deviations above (৳115.29) and below (৳102.57). Panels show RSI (28.26), MACD (-3.15 vs signal -2.83) and DMI/ADX, which measures trend strength (ADX 15.54, -DI 26.76 above +DI 13.26). Price rode the upper band to ৳144.0 in July, then walked down the lower band from late August; it now sits on the lower band with RSI in oversold territory.
What would change the picture
The scenario cards list price conditions and what each would mean for the chart's structure if it happened. They are not predictions; they simply tell you which levels would change the picture, so you can check them against later closes.
Recent changes and what followed
Each row is a day a tracked signal changed, and the price move over the next 5, 20 and 60 trading days (blank until that many days have passed). Past moves do not predict future ones.
| Date | Change | Close | Next 5 days | Next 20 days | Next 60 days |
|---|---|---|---|---|---|
| 2026-11-01 | RSI fell to 30 or below | ৳102.60 |
- Computed from daily closing prices (method t1, wording agent-2); history kept from 2026-11-01.
- Describes price history only. Not investment advice, not a rating or a price target.