Sikder Insurance Company Limited (SICL) technical report
As of the 2026-11-01 close. Updated every trading day. Company page · All DSE stocks: technical data
In plain words
Sikder Insurance has had a big year. After trading between roughly ৳18 and ৳26 for most of 2025, the share price surged from about ৳21 in April 2026 to a high of ৳43.3 in July, then ranged and slipped. On 27 October it fell to ৳27.8, about 36% below that high. Since then it has rebounded to ৳32.9. Two moving averages help frame this. The 200-day average, the average closing price of the last 200 trading days, is ৳30.57 and price is above it. The 50-day average is ৳35.36 and price is below it, and that average is still sloping down. The last day's volume of 316,777 shares was about 1.3 times the recent average, a modest pickup. The levels that matter are ৳33.0–34.1 just above price, ৳35.0–36.0 above that, and ৳29.4–30.6 below.
Key levels
Support is where buyers have stepped in before; resistance is where sellers have capped rallies. Here, ৳29.4–30.6 held on 12 and 28 October and contains the 200-day average, with ৳27.8 as the October low. Above price, ৳33.0–34.1 turned price back on 11 October, and ৳35.0–36.0 was the base before the October drop.
Trend on each timeframe
The monthly chart still shows an advance from the 2025 range, while the weekly picture has become a pullback: price sits between the 10-week and 40-week averages. The daily chart has been lower since July but bounced off the 200-day average, and the hourly chart is the strongest, with price above both of its averages. The longer charts are mixed; only the shortest is clearly rising.
Monthly Up
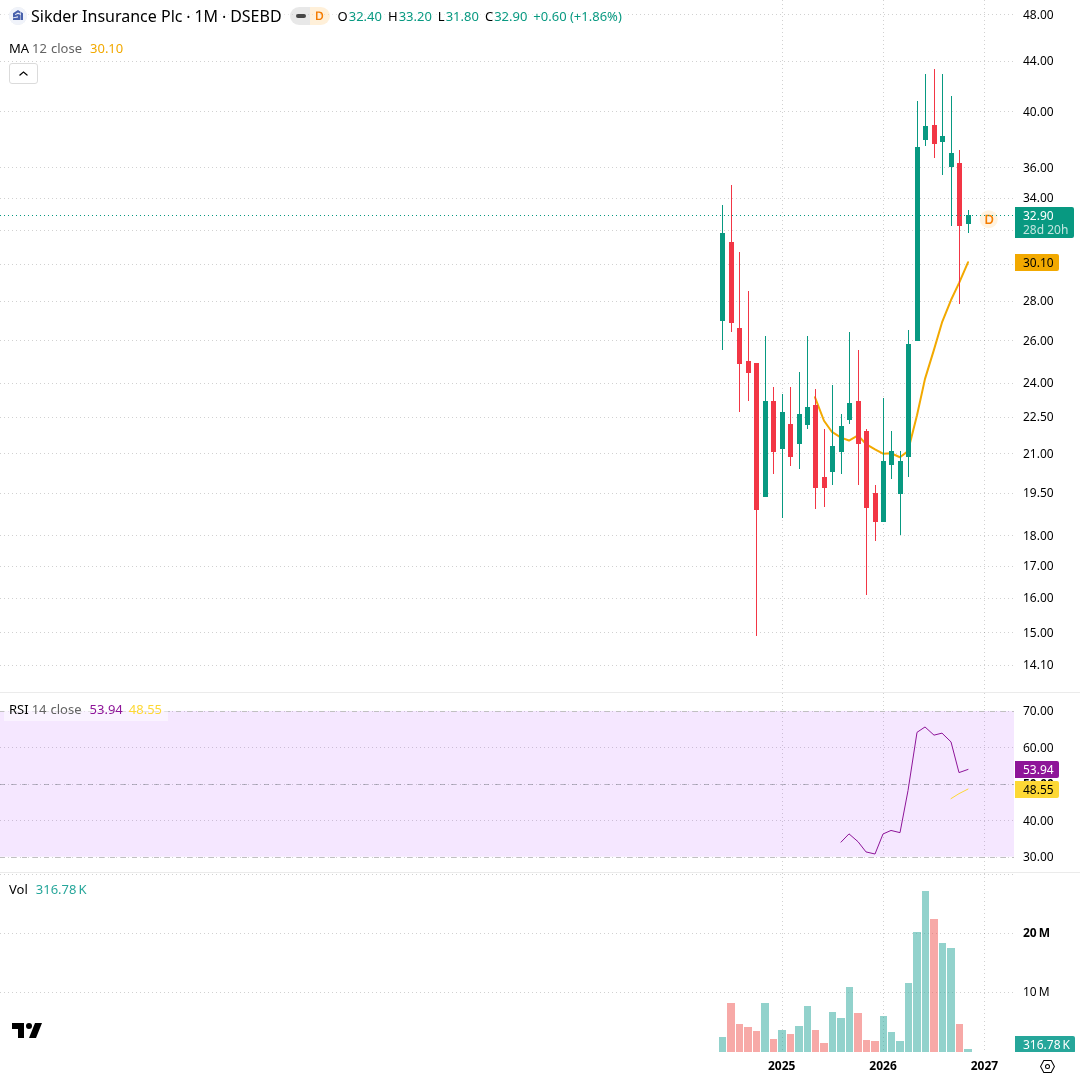
This chart covers about two and a half years of history; each candle is one month. The orange line is the 12-month average (৳30.10), the middle panel is RSI (53.9) and the bottom panel is volume. After touching ৳34.8 in mid-2024, price fell to ৳14.9 in October 2024, ranged for most of 2025, then climbed in 2026 to a ৳43.3 high in July. September closed at ৳37.0 and October at ৳32.3. The November candle has only one day so far, at ৳32.9. Price is above the 12-month average, and volume peaked during the 2026 climb.
Weekly Sideways
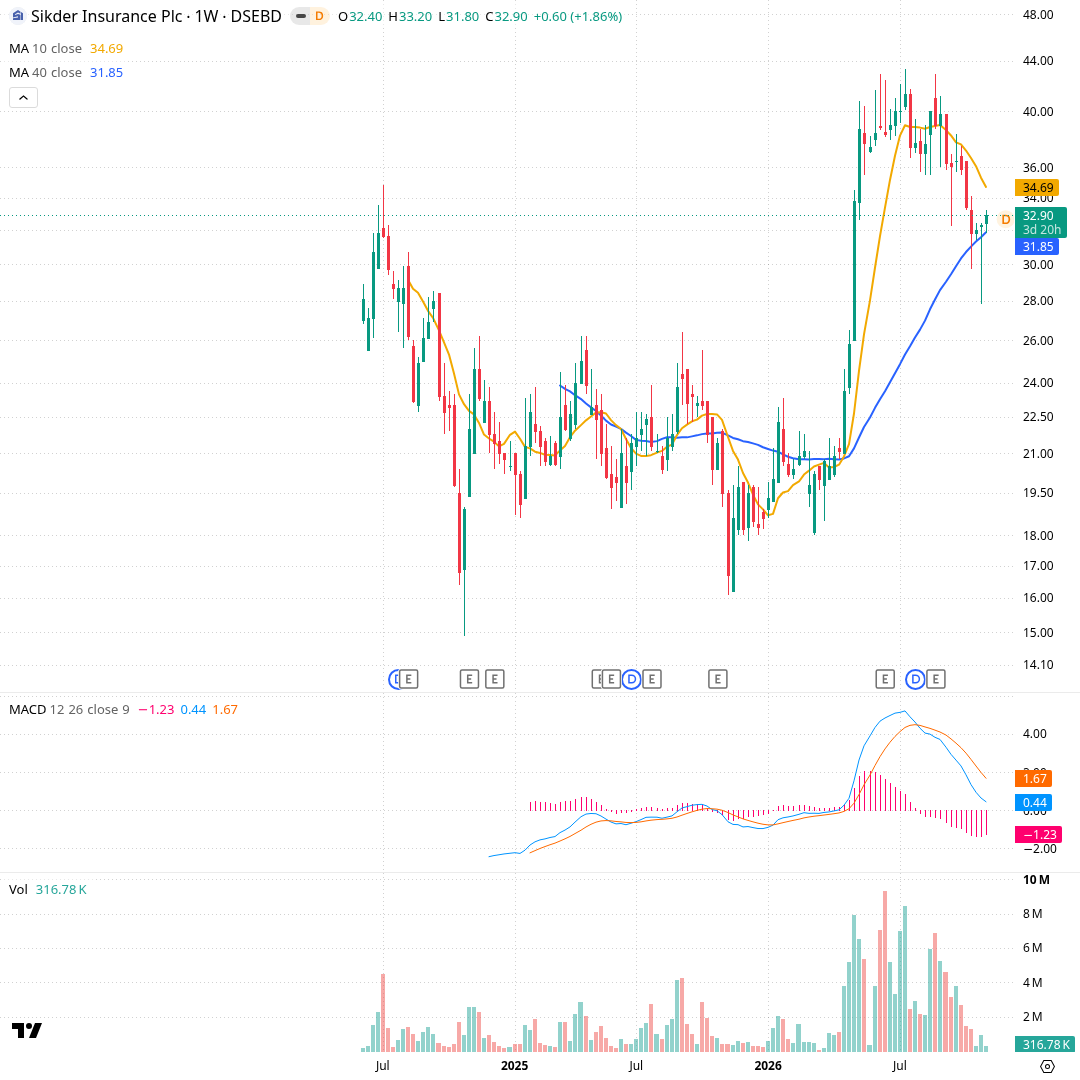
Weekly candles for about two and a half years; one candle is one week. The orange line is the 10-week average (৳34.69) and the blue line the 40-week average (৳31.85). MACD (line 0.44, signal 1.67) and weekly volume sit below. Price held ৳18.6–26.4 for most of 2025, then rose from about ৳21 in April 2026 to a ৳43.3 high in the week of 12 July, which also saw 8.5 million shares trade. It has since fallen to a ৳27.8 low in the week of 25 October and now sits between the two averages.
Daily Down
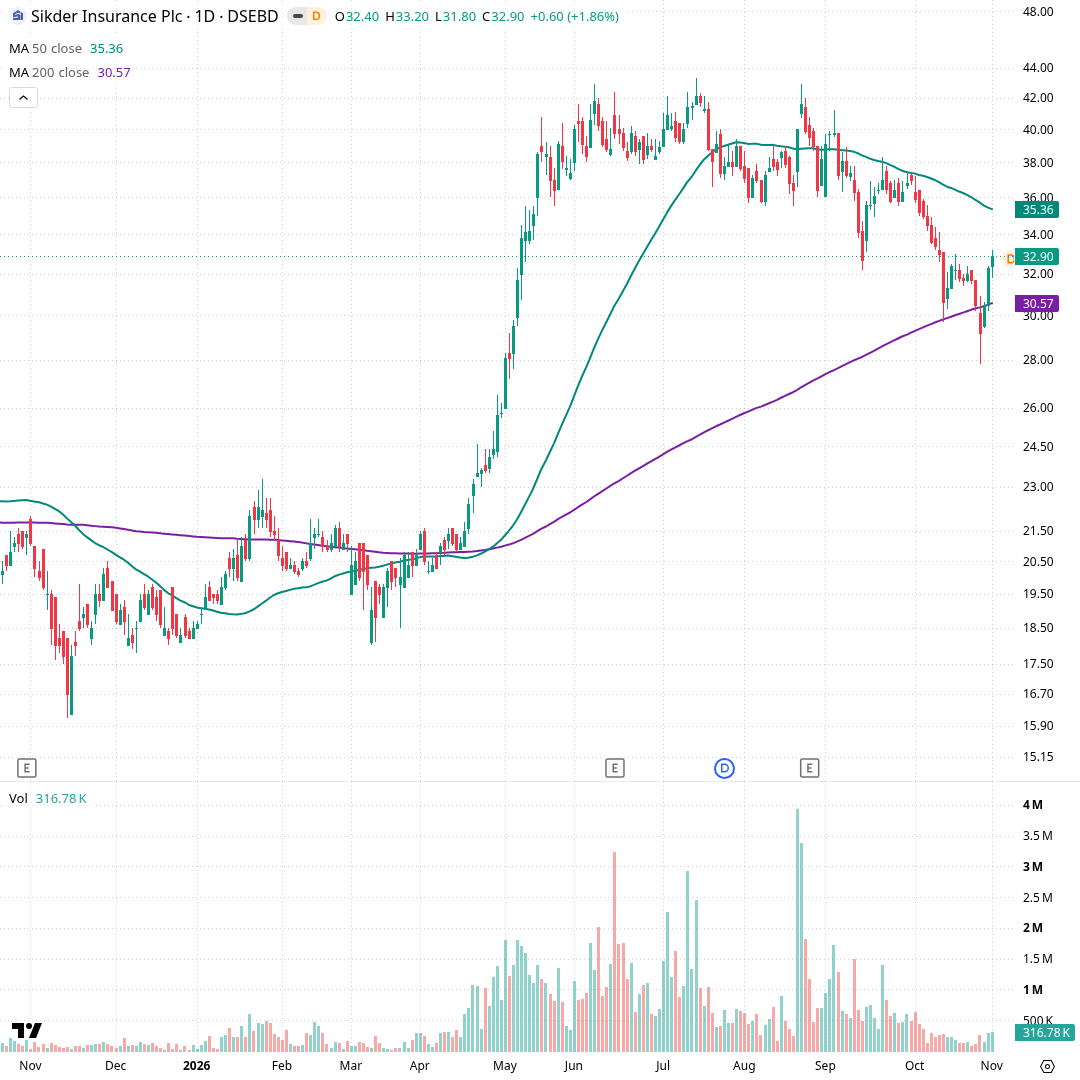
Daily candles for roughly the past year; one candle is one trading day. The green line is the 50-day average (৳35.36) and the purple line the 200-day (৳30.57). Price rose from about ৳21 in April to above ৳38 by mid-May on rising volume, ranged roughly ৳36–43 through the summer with a ৳43.3 high on 14 July, then fell through the 50-day in September. On 27 October it dipped to ৳27.8, below the 200-day, closed back above it and has since risen to ৳32.9 on volume of 316,777 shares.
Hourly Up
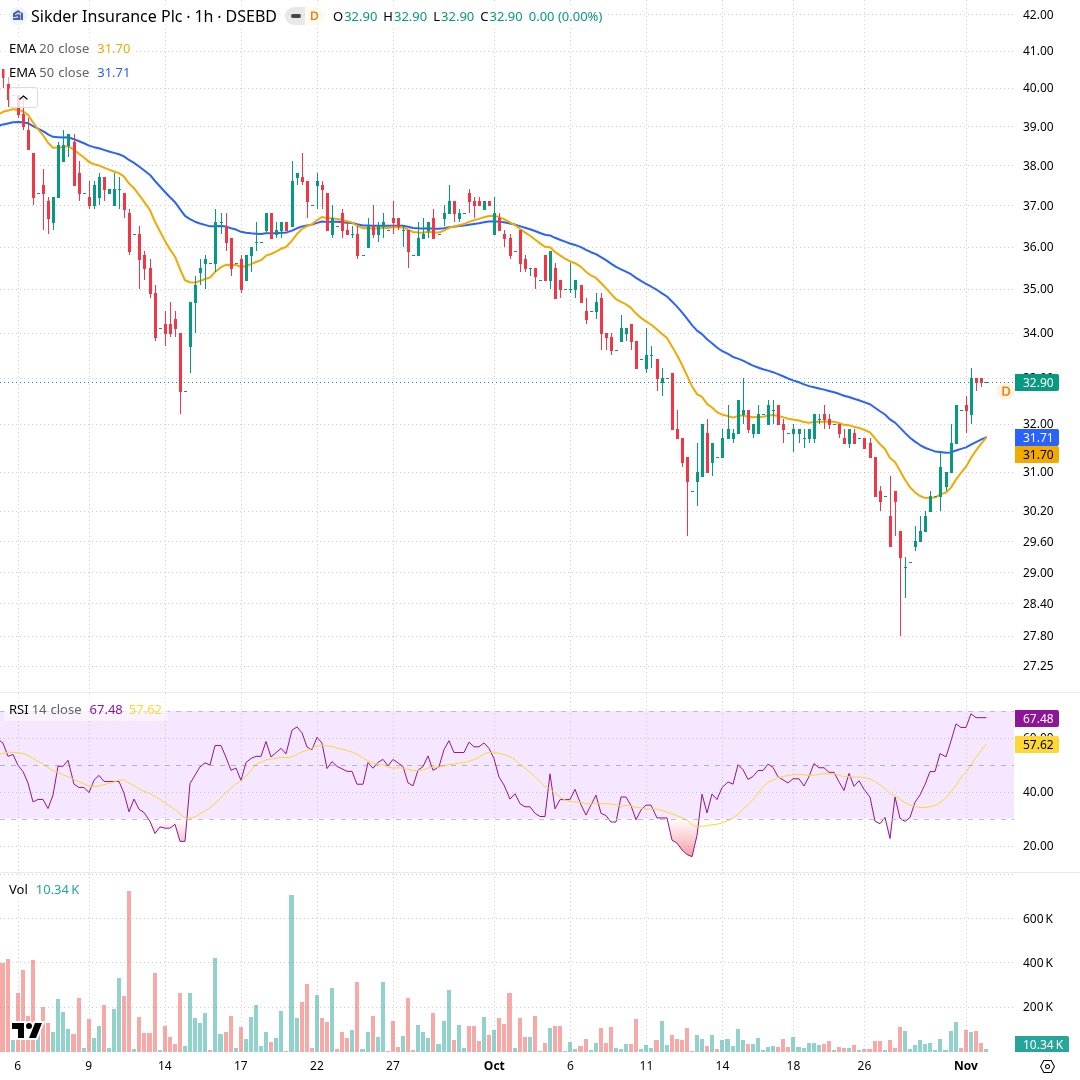
Hourly candles for about two months; one candle is one hour of trading. The orange line is the 20-hour exponential average (৳31.70) and the blue line the 50-hour (৳31.71); an exponential average gives more weight to recent prices. The middle panel is RSI (67.5) and the bottom panel is volume. Price slid from about ৳36 at the start of October to ৳27.8 on 27 October, then rose in a steady run to ৳32.9, crossing above both averages, which have only just come together.
Momentum and volume
Momentum has improved from a low base. The daily RSI is 49.0, near the middle of its 0–100 range, and the hourly RSI is 67.5. The daily MACD line (−1.15) has just moved above its signal line (−1.31), though both are below zero. ADX at 31.2 still shows a trend, with the sellers' line (35.6) above the buyers' (19.3). Volume is 1.3 times average.
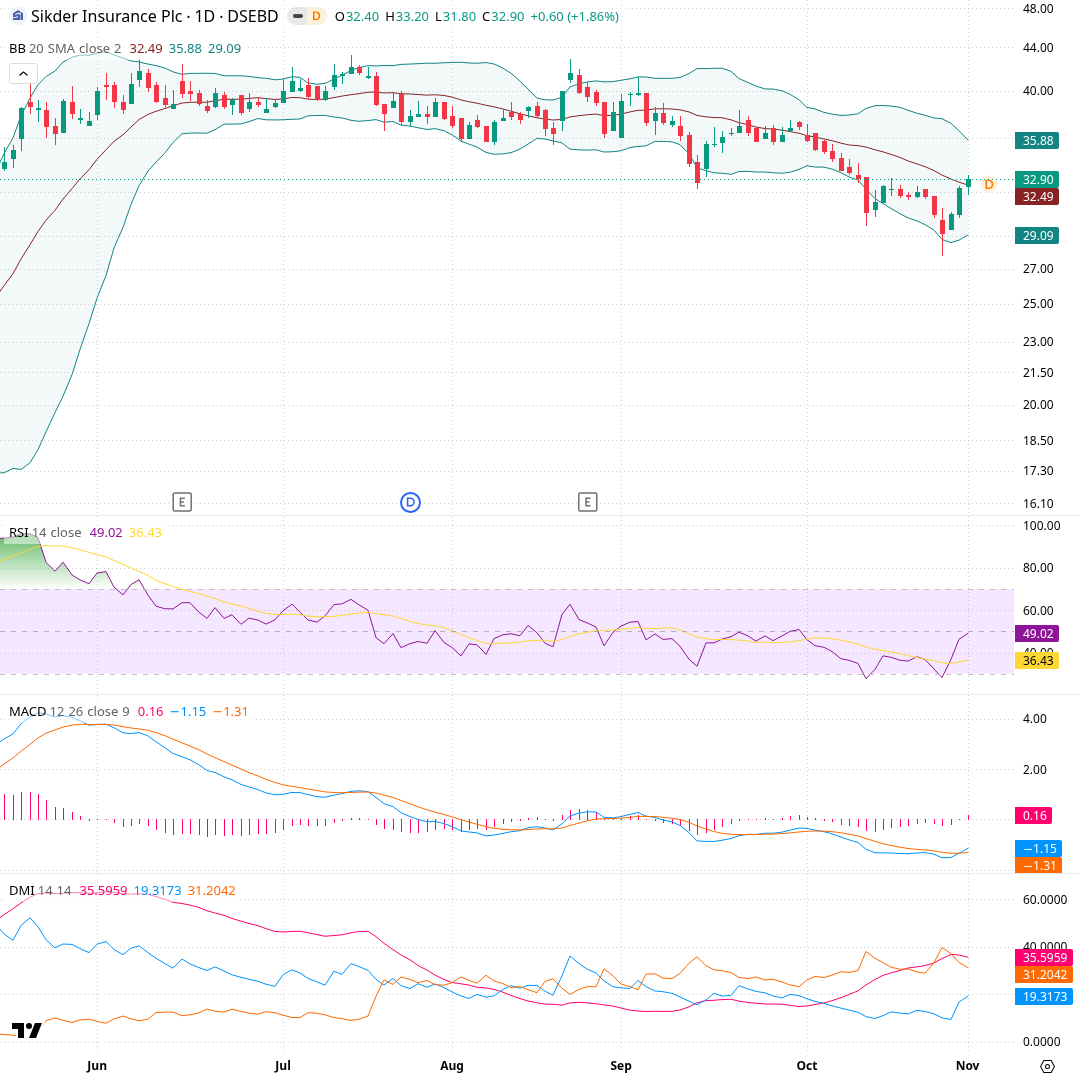
Daily candles for about six months; one candle is one trading day. Bollinger Bands (20, 2) show the 20-day average (৳32.49) in the middle with outer bands at ৳35.88 and ৳29.09. Below are RSI (49.0), MACD (line −1.15, signal −1.31) and ADX with its +DI and −DI lines. Price touched the lower band on 27 October, rebounded and now sits just above the middle line. RSI rose from around 30 to 49, MACD has just moved above its signal line, and ADX is 31.2 with −DI at 35.6 above +DI at 19.3.
What would change the picture
The cards above are conditions to watch, not predictions. Each one says what a particular close would mean for the structure of the chart if it happened; none says that it will happen, and none is advice.
Recent changes and what followed
Each row is a day a tracked signal changed, and the price move over the next 5, 20 and 60 trading days (blank until that many days have passed). Past moves do not predict future ones.
| Date | Change | Close | Next 5 days | Next 20 days | Next 60 days |
|---|---|---|---|---|---|
| 2026-11-01 | MACD crossed above its signal line | ৳32.90 | |||
| 2026-10-29 | Closed above the 200-day average | ৳32.30 |
- Computed from daily closing prices (method t1, wording agent-2); history kept from 2026-10-29.
- Describes price history only. Not investment advice, not a rating or a price target.