SBAC Bank PLC. (SBACBANK) technical report
As of the 2026-11-01 close. Updated every trading day. Company page · All DSE stocks: technical data
In plain words
SBAC Bank has spent the past two months in a quiet sideways channel. After sliding to ৳5.0 in November 2025 and ৳5.2 in May, the price rallied hard in late July to ৳8.1, its 52-week high, on unusually heavy trading. That spike faded within weeks. Since September the price has stayed between ৳6.5 and ৳7.0 and closed the latest session at ৳6.8, up 3.03 percent. It sits on top of its 50-day average of ৳6.74 and 200-day average of ৳6.58, which are the average closing prices of the last 50 and 200 trading days. Both are flat. Daily trading volume is light, near 0.94 times its recent average. The important levels are the ৳7.0 top of the range and the ৳6.5 to ৳6.6 floor.
Key levels
Support is a price area where falling prices have stopped before; resistance is where rises have stalled. For this stock, ৳7.0 has capped every attempt since September, while ৳6.5 to ৳6.6 has caught every dip. Further up, ৳7.5 to ৳7.6 and the July high of ৳8.1 mark where earlier rallies ran out of steam.
Trend on each timeframe
The four time frames largely agree on a sideways picture. The monthly and weekly averages are flat and close to price, the daily chart shows a narrow range, and the hourly chart shows price just above its short averages. The longer view is a multi-year decline from the 2021 debut, but the last two months show no direction.
Monthly Sideways
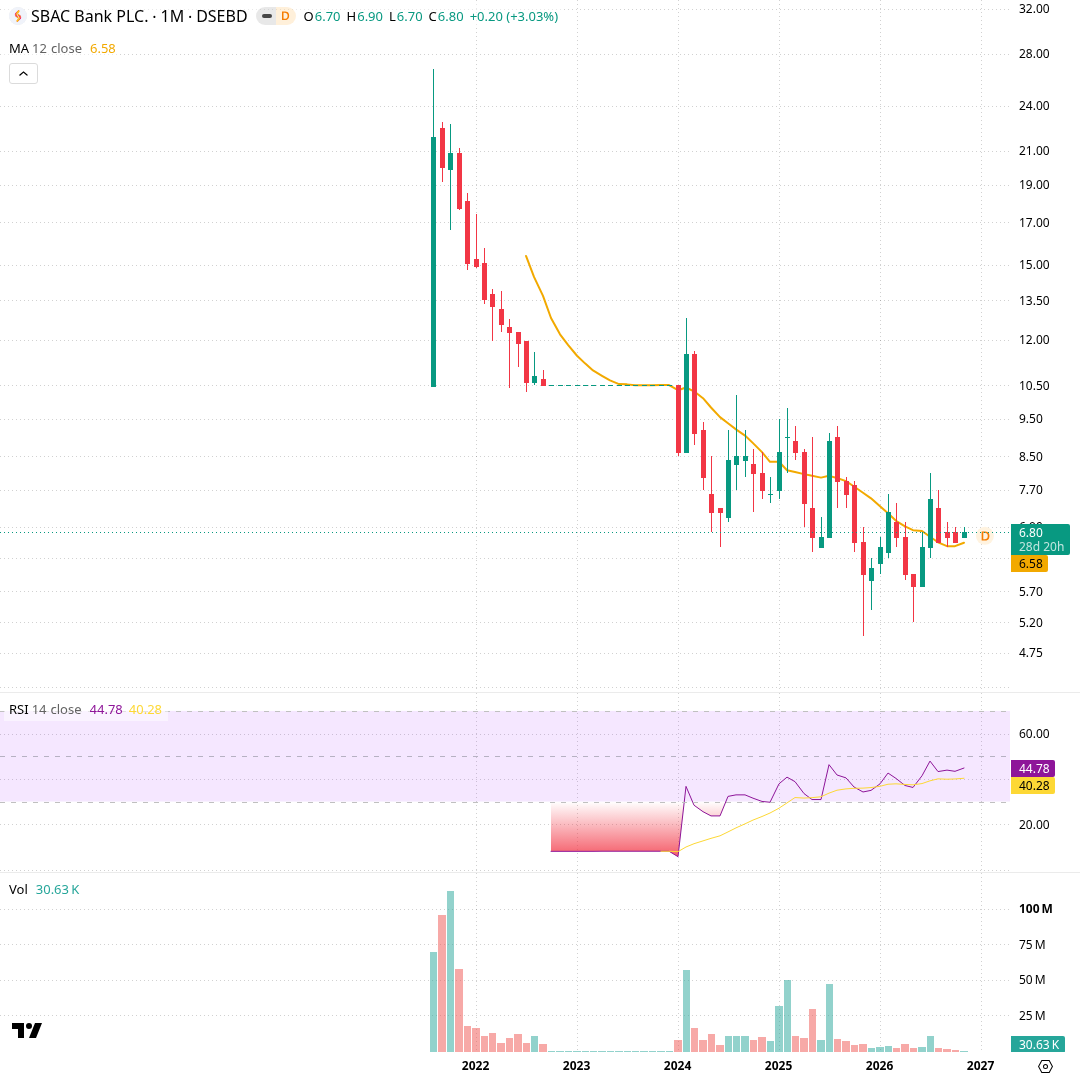
Each candle is one month and the chart covers the stock's whole listed history of about five years. The orange line is the 12-month average of closes, now at ৳6.58, and the lower panel shows RSI (14) at 44.78, a gauge of recent strength. After the large decline from its 2021 debut, price has moved in a lower, narrower band since 2024. This month's candle at ৳6.80 sits just above the average, which has flattened. Volume has dwindled to 30.63K shares so far this month.
Weekly Sideways
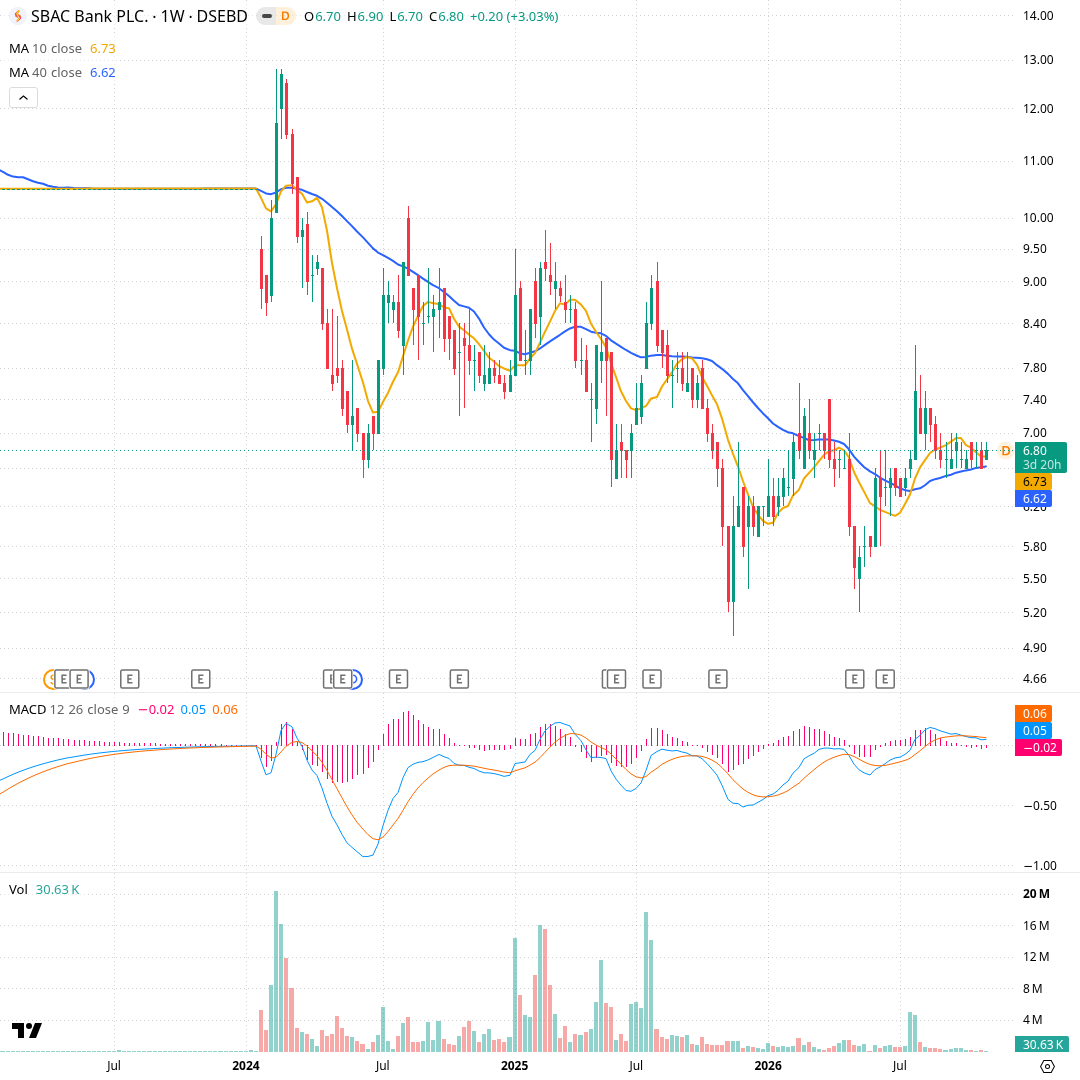
Each candle is one week, spanning about four years. The orange line is the 10-week average (৳6.73) and the blue line the 40-week average (৳6.62); the two have converged and are now flat. MACD, which compares two averages to show momentum, reads 0.05 against a signal of 0.06, both near zero. After the July weekly high of ৳8.1 on heavy volume, price retraced to ৳6.7 and has traded in narrow weekly candles since. Weekly volume has fallen from 5.0 million in July to 30,627 this week.
Daily Sideways
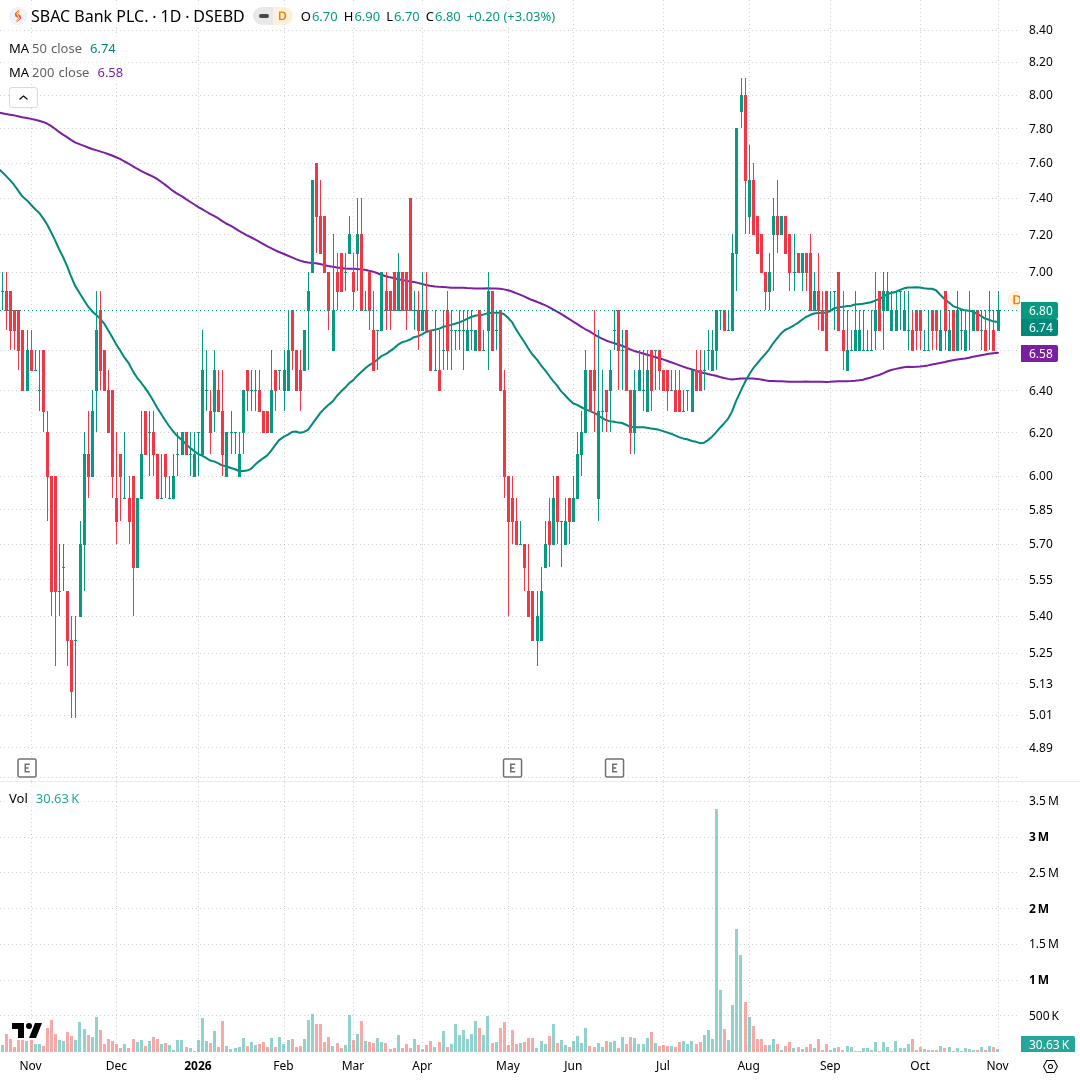
Each candle is one trading day over the last 250 days. The green line is the 50-day average (৳6.74) and the purple line the 200-day average (৳6.58). Price bottomed at ৳5.0 in November 2025, recovered to ৳7.6 by February, dropped to ৳5.2 in May, then rallied to ৳8.1 in late July on volume above 3 million. Since September it has held between ৳6.5 and ৳7.0 on thin volume, with both averages now flat and converging beneath price at ৳6.80.
Hourly Sideways
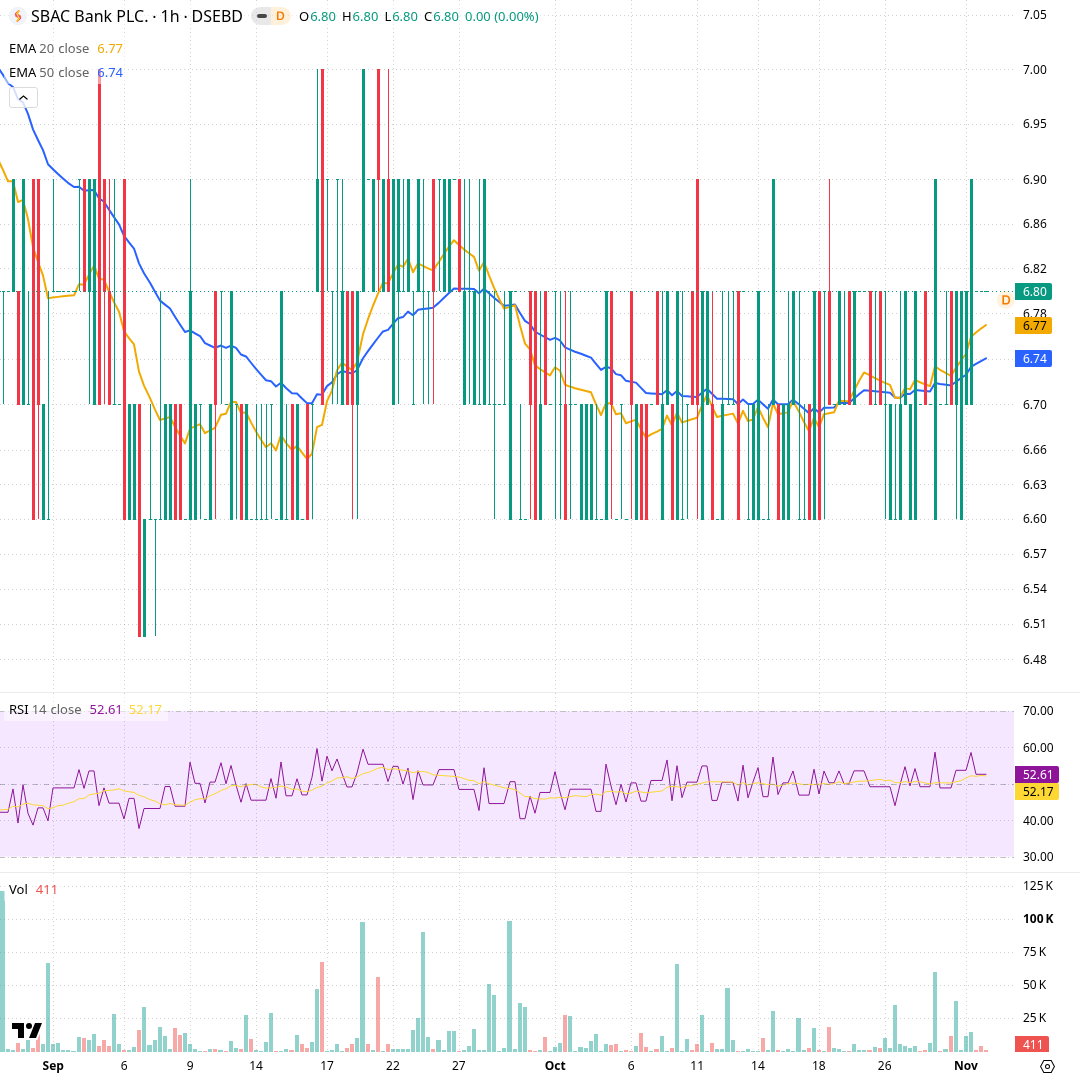
Each candle is one trading hour, covering about two months. The orange line is the 20-hour exponential average (৳6.77) and the blue line the 50-hour (৳6.74); exponential averages weight recent prices more. Price moves in a stack of bars between ৳6.60 and ৳6.90, because the stock trades in ৳0.10 steps, and it now sits at ৳6.80 just above both lines. Hourly RSI reads 52.6, close to neutral. Volume bars are very small, with a typical hour below 25K shares.
Momentum and volume
Momentum readings sit near neutral. RSI is 53.2, MACD is flat at zero, and Bollinger bands are tight, which means the stock has been moving in a small range. ADX at 29.0 is higher than the flat price suggests, so treat it with care. Volume is light, so neither buyers nor sellers are in control.
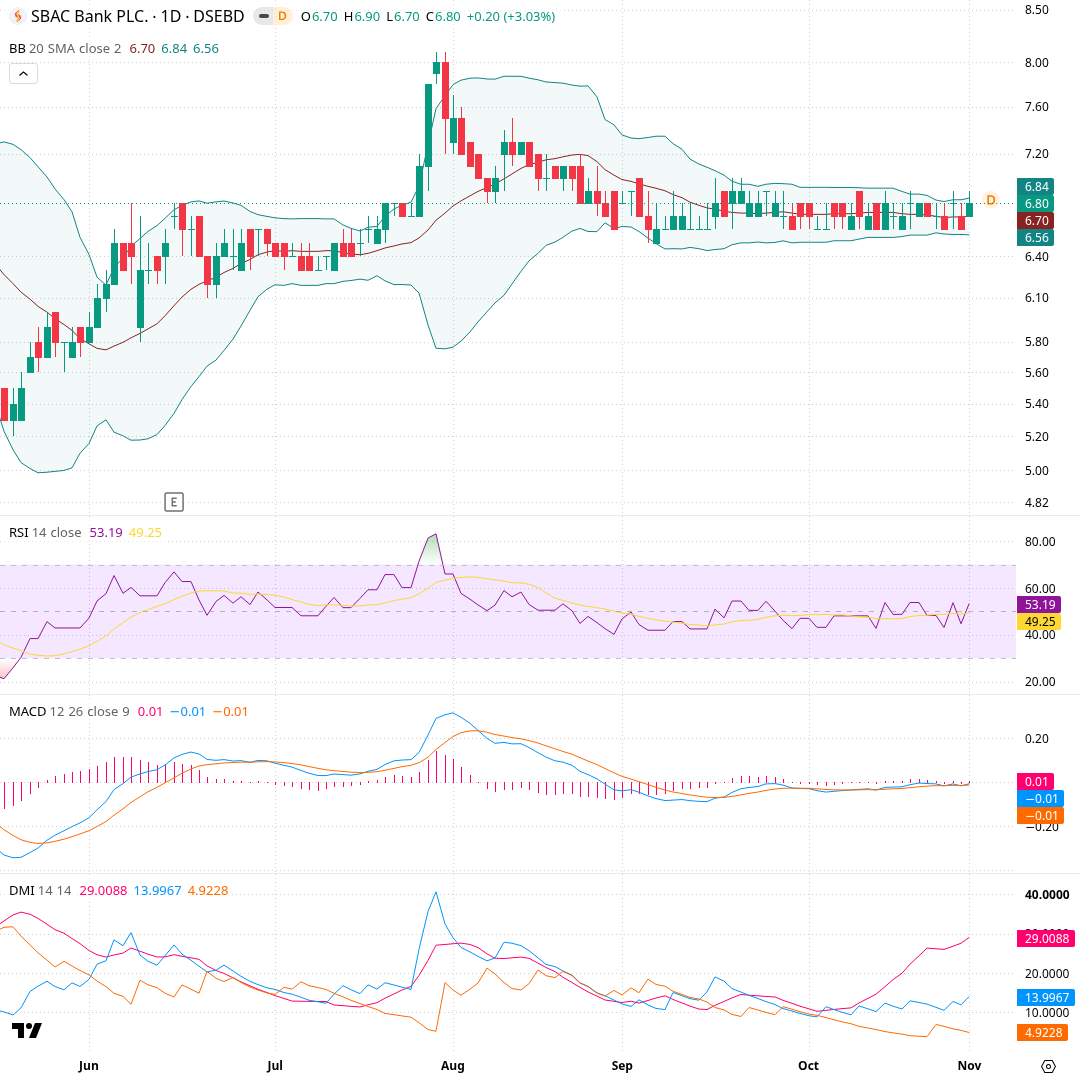
Each candle is one trading day over roughly the last six months. The shaded band is Bollinger Bands (20, 2), spanning two standard deviations around the 20-day average: ৳6.56 to ৳6.84 with the midline at ৳6.70. Below are RSI (53.19), MACD (-0.01 with signal -0.01) and ADX (29.01), a measure of trend strength that ignores direction. The bands have narrowed sharply from their August width after the July spike, RSI oscillates around 50, and MACD hugs zero, which together mark a quiet, compressed stretch.
What would change the picture
The scenario cards describe conditions to watch on the chart, not predictions. Each names a closing price and what it would change about the picture. They do not say the stock will reach those prices; they show which levels carry the most weight.
Recent changes and what followed
Each row is a day a tracked signal changed, and the price move over the next 5, 20 and 60 trading days (blank until that many days have passed). Past moves do not predict future ones.
| Date | Change | Close | Next 5 days | Next 20 days | Next 60 days |
|---|---|---|---|---|---|
| 2026-11-01 | Closed above the 200-day average | ৳6.80 | |||
| 2026-11-01 | MACD crossed above its signal line | ৳6.80 | |||
| 2026-10-29 | MACD crossed below its signal line | ৳6.60 |
- Computed from daily closing prices (method t1, wording agent-2); history kept from 2026-10-29.
- Describes price history only. Not investment advice, not a rating or a price target.