Regent Textile Mills Limited (REGENTTEX) technical report
As of the 2026-11-01 close. Updated every trading day. Company page · All DSE stocks: technical data
In plain words
Regent Textile Mills has had a very large swing in the past year. Its price collapsed to ৳1.3 in November 2025, rebuilt slowly through early 2026, then surged to ৳8.4 on June 11, 2026 on heavy trading. Since that peak it has made lower highs of ৳7.7 in July, ৳6.8 in early September and ৳5.3 in mid-October, and on November 1 closed at ৳4.8. The 200-day average, the average closing price of the last 200 trading days, is ৳5.22; price slipped under it in October. The 50-day average, which covers 50 days, is ৳5.74 and is falling. Daily swings are large: the average daily range is about 7% of price, so levels can be crossed quickly. Trading volume has dried up to 51,326 shares, about half of its recent average.
Key levels
Regent's nearest support is ৳4.5, the low held on three straight sessions in late October, then ৳4.3, the October 14 spike low. Resistance starts at the ৳5.1-5.3 area, where the mid-October bounce stalled, and the 200-day average (৳5.22) sits inside it. Above that, ৳5.7-6.3 is the September trading range.
Trend on each timeframe
The monthly chart shows a deep rebound from ৳1.3 that has been partly retraced. The weekly chart has turned down, with price under both averages and MACD negative. The daily chart is the weakest, with price under the 200-day line and sellers clearly ahead. The hourly chart is flat near ৳4.8, so the very short term is quiet while the larger pictures lean lower.
Monthly Sideways
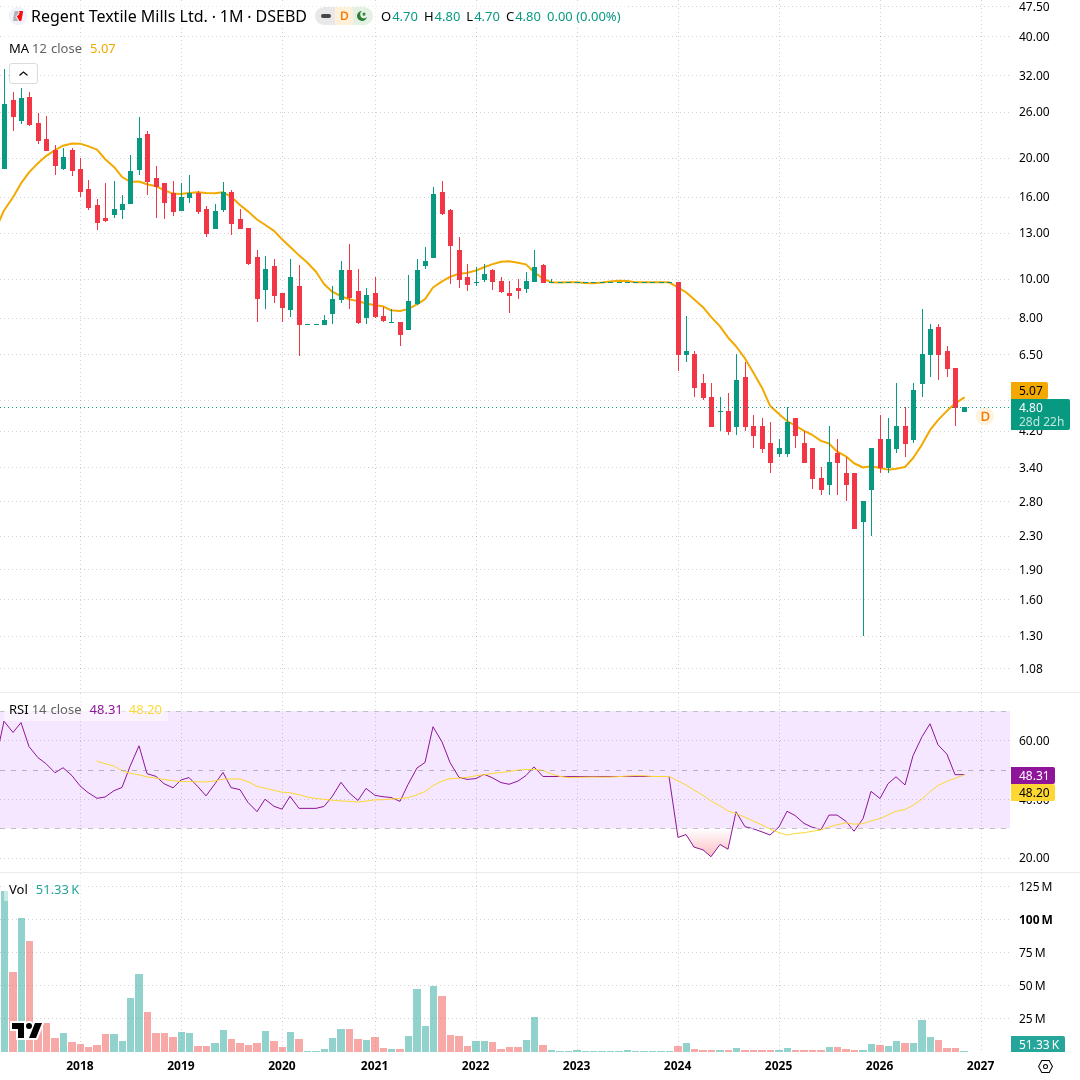
Each candle is one month and the chart covers about ten years. The orange line is the 12-month average (৳5.07), the average of the last year of monthly closes; below are RSI (48.3), a 0-100 gauge of recent strength, and volume. After a peak near ৳17.5 in 2021, the stock traded flat around ৳9.8 from late 2022 through 2023, then dropped in January 2024. It bottomed at ৳1.3 in November 2025, rebounded to ৳8.4 in June 2026 on heavy volume, and has since fallen back to ৳4.8, just under the 12-month line.
Weekly Down
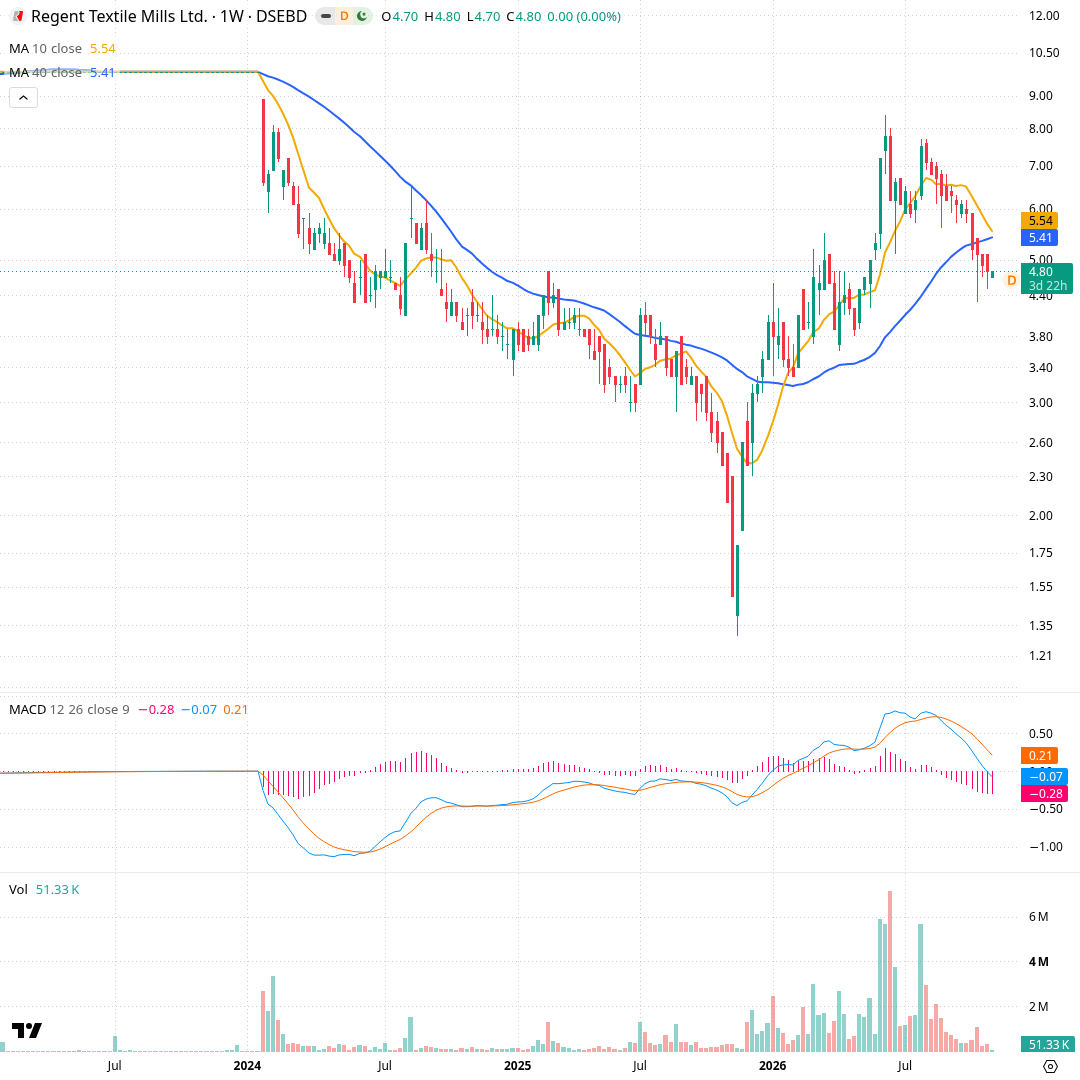
Each candle is one week, covering about four years. The orange line is the 10-week average and the blue line the 40-week average; below are MACD, a momentum gauge built from two moving averages, and volume. After the January 2024 drop, price drifted down to a weekly low of ৳1.3 in November 2025, then rose in steps to a weekly high of ৳8.4 in early June 2026, with weekly volume peaking at 7.1M shares in mid-June. Since then price has made lower highs and closed last week at ৳4.8, under both averages with MACD turning negative.
Daily Down
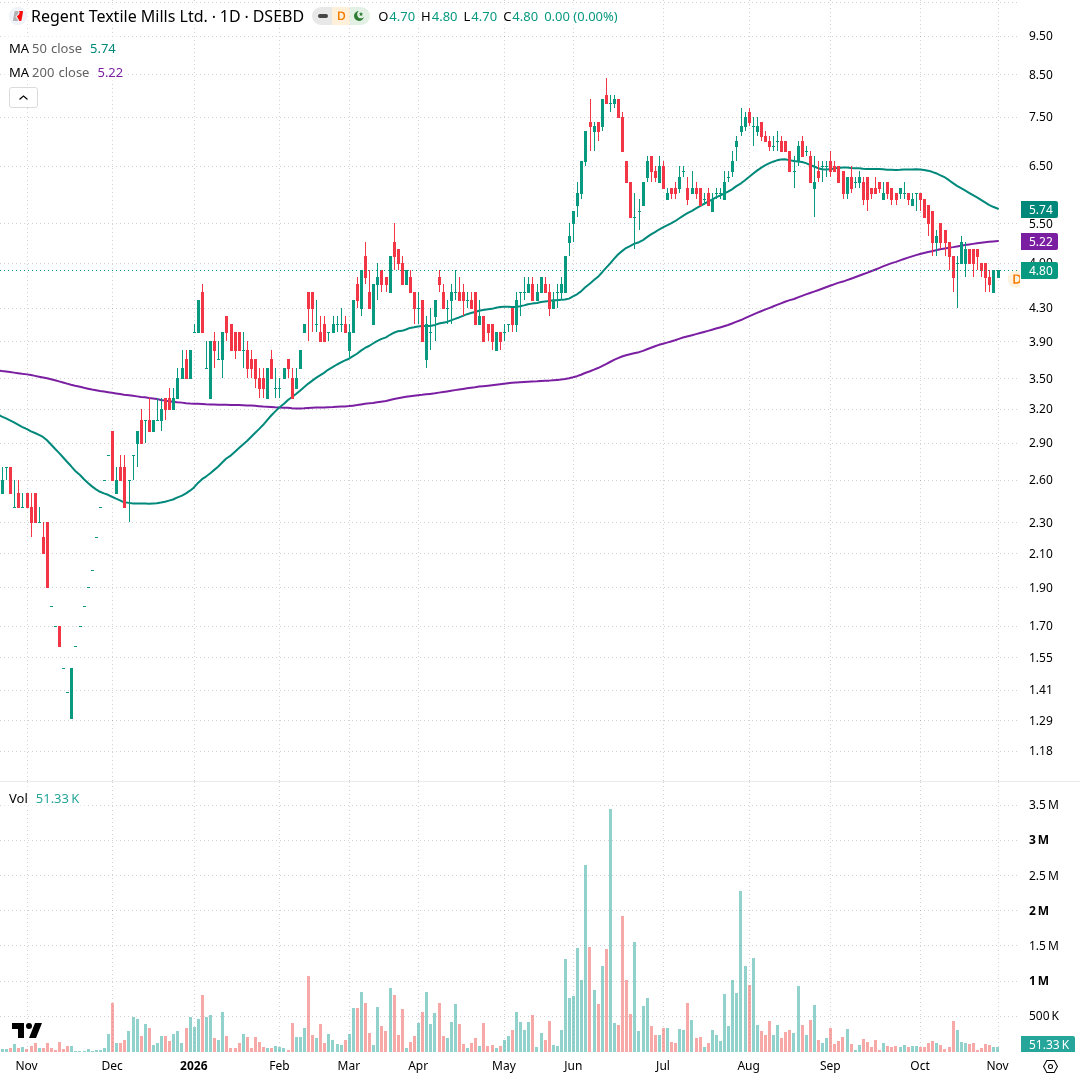
Each candle is one trading day, covering about a year. The green line is the 50-day average (৳5.74) and the purple line the 200-day average (৳5.22); bars below show volume. Price rose from ৳1.3 in mid-November 2025 to ৳8.4 on June 11, 2026, on volume of up to 3.4M shares a day, failed near ৳7.7 in late July, then declined through September and October. It fell under the 200-day line and set a low of ৳4.3 on October 14. The last close is ৳4.8, with volume now light at 51,326.
Hourly Sideways
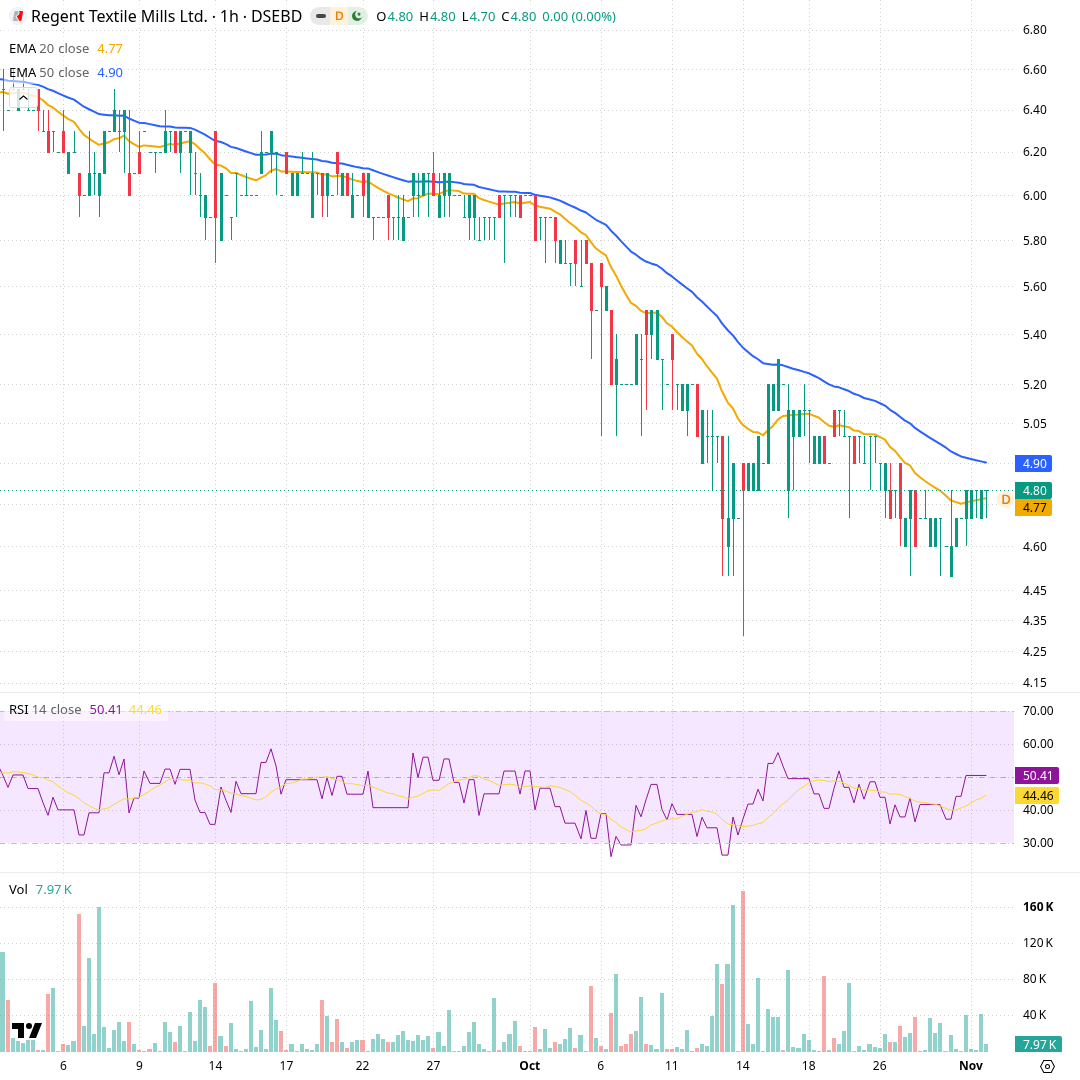
Each candle is one hour of trading, covering about two months. The orange line is the 20-hour exponential average (৳4.77) and the blue line the 50-hour (৳4.90); below are RSI (50.4) and volume. The hourly picture shows a long staircase down from the ৳6 area in early September to the October 14 low of ৳4.3, a partial bounce toward ৳5.3, and then a drift lower again. In the last few sessions price has stalled at ৳4.8, above the 20-hour line and under the 50-hour line, with RSI at the neutral 50 mark.
Momentum and volume
Momentum is weak. RSI at 37.7 is below 50 and nearing, but not at, the oversold level of 30. ADX at 46.6 indicates a very strong trend, and the directional lines show sellers (25.0) far ahead of buyers (6.3). MACD has flattened and volume is light, so selling pressure has eased even though the trend remains down.
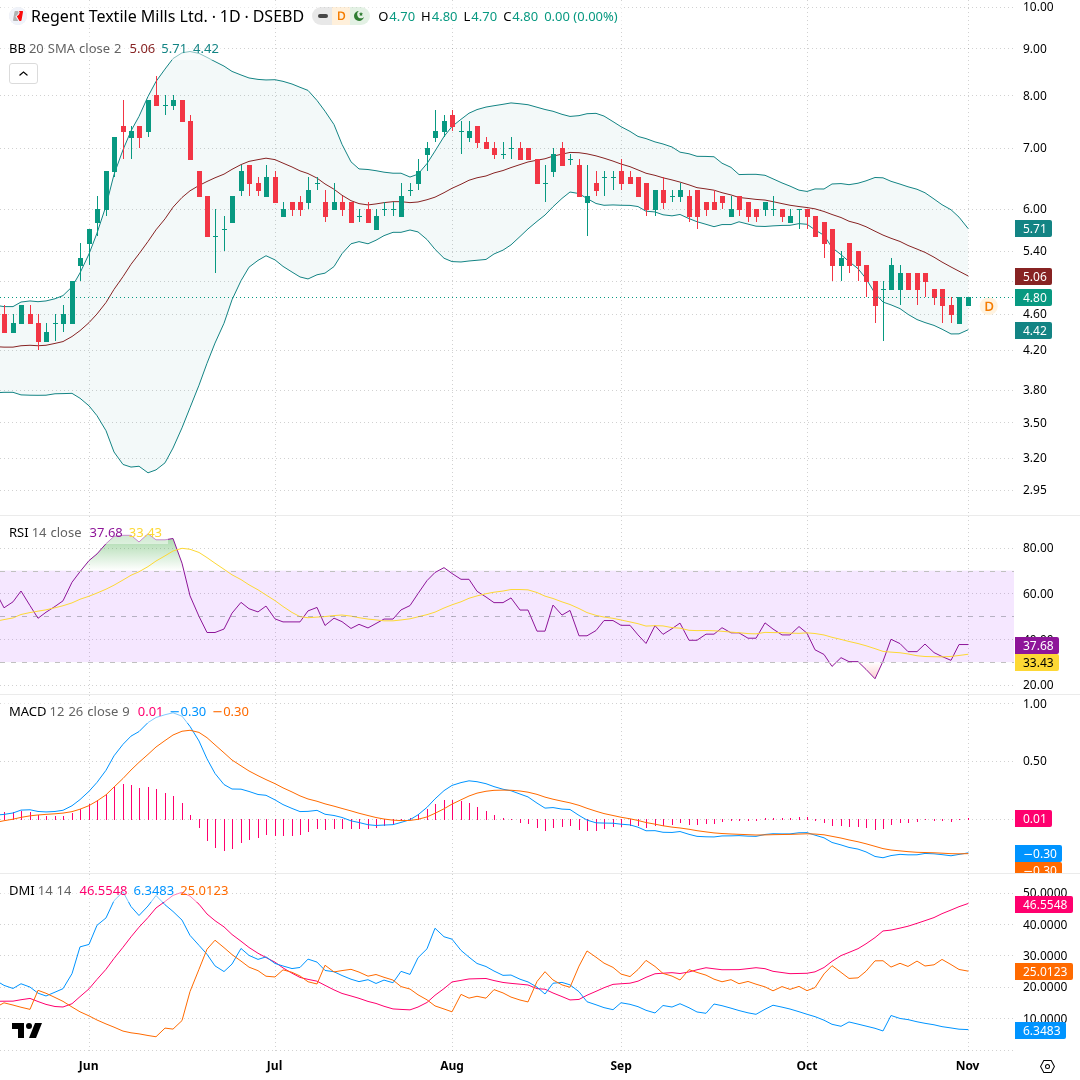
Each candle is one trading day over about six months. The shaded band is Bollinger Bands (20, 2): a 20-day average (৳5.06) with outer bands at ৳5.71 and ৳4.42. Below are RSI (37.7), MACD (-0.30, level with its signal at -0.30) and ADX (46.6, with -DI 25.0 far above +DI 6.3). Price fell through the lower band in early October, bounced to ৳5.3, and is now near the lower band again at ৳4.8. The wide band shows volatility is still high, and ADX shows the downtrend is strong.
What would change the picture
The scenario cards describe conditions to watch on the chart, not predictions. Each one says what a particular close would change about the structure. Price can move without meeting any of them, and none of them implies that a move will follow.
Recent changes and what followed
Each row is a day a tracked signal changed, and the price move over the next 5, 20 and 60 trading days (blank until that many days have passed). Past moves do not predict future ones.
| Date | Change | Close | Next 5 days | Next 20 days | Next 60 days |
|---|---|---|---|---|---|
| 2026-11-01 | MACD crossed above its signal line | ৳4.80 | |||
| 2026-10-29 | Closed above the nearest resistance level | ৳4.80 |
- Computed from daily closing prices (method t1, wording agent-2); history kept from 2026-10-29.
- Describes price history only. Not investment advice, not a rating or a price target.