Provati Insurance PLC. (PROVATIINS) technical report
As of the 2026-11-01 close. Updated every trading day. Company page · All DSE stocks: technical data
In plain words
Provati Insurance spent most of 2024 and 2025 trading in a low range, mostly between ৳25 and ৳37, and hit ৳22.9 in November 2025. In 2026 it rallied strongly, reaching ৳70.8 in early July on very heavy trading. It then gave back part of that gain, falling to ৳43.3 in mid-October, close to the 200-day average (the average closing price of the last 200 trading days, ৳44.67 now). Since that low the stock has bounced quickly to ৳59.1, up 2.07% today, and it is now above its 50-day average (the average of the last 50 closing prices, ৳53.66). The price is about 16.5% below its 52-week high. The areas that matter now are ৳60 to ৳62.3 overhead, where rallies stalled in August, and ৳53.4 below, the late-October dip. The October low of ৳43.3 remains the deeper reference point.
Key levels
Support is a price where buying has stopped falls before; resistance is where selling has stopped rises. On Provati, ৳61.5–62.3 capped several rallies in July and August, and ৳70.8 is the year's top. Below, ৳53.4 held the late-October dip, and ৳43.3 marked the October low where price bounced sharply off the 200-day average.
Trend on each timeframe
The monthly and weekly charts show a breakout from a long base, with price above rising longer averages. The daily chart shows a deep pullback from July that has now partly recovered. The hourly chart is the strongest, with steady higher lows since 12 October. The main disagreement is the weekly MACD, which is still below its signal line after the summer peak.
Monthly Up
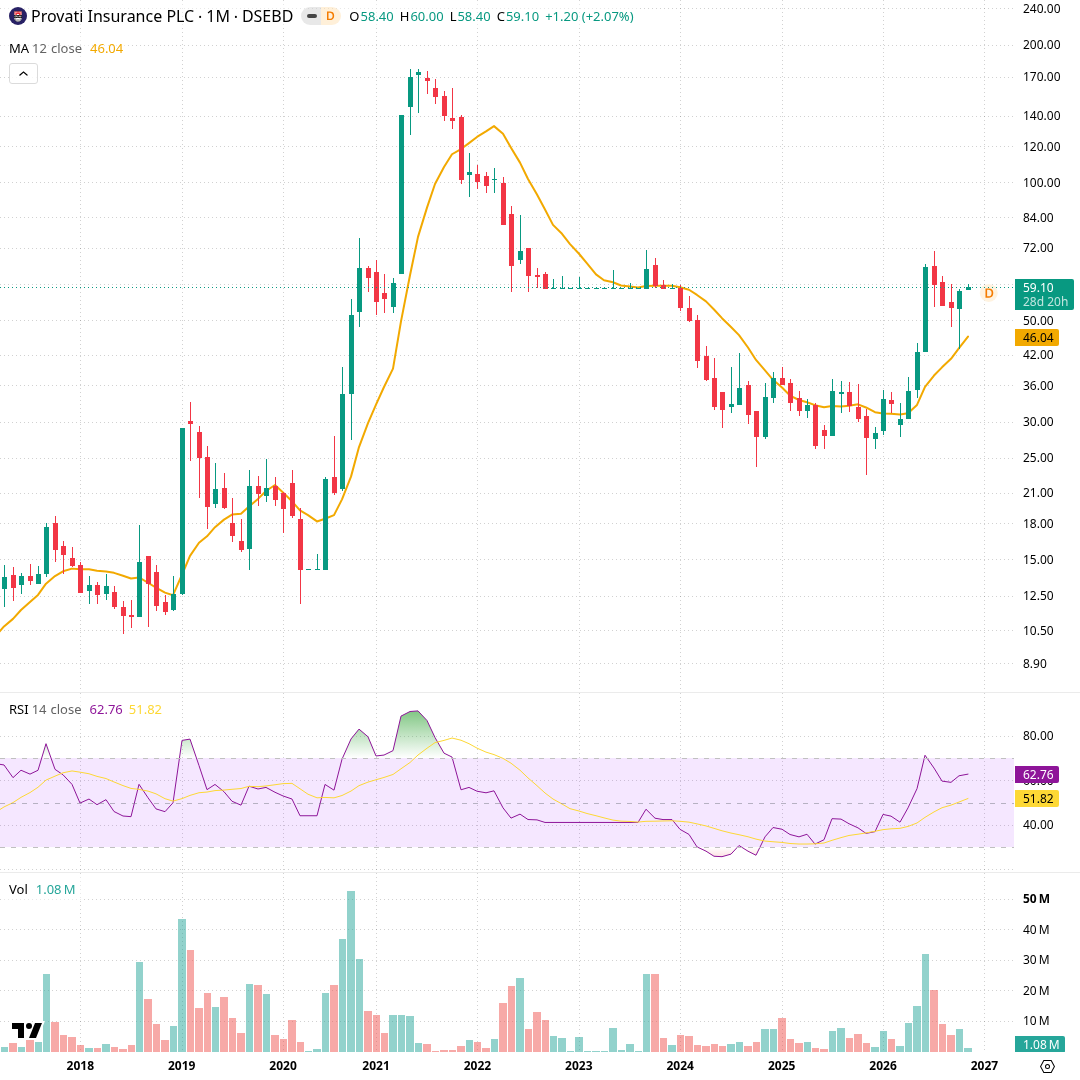
Each candle is one month, covering about ten years. The orange line is the 12-month simple average (৳46.04); the lower panels show RSI (14), a 0–100 momentum gauge, and monthly volume. After peaking near ৳170 in 2021 the stock slid into a long base mostly between ৳25 and ৳37 through 2024–2025. In 2026 it broke out on heavy volume, reaching ৳70.8 in July. November so far trades between ৳58.4 and ৳60.0, above the 12-month average, with monthly RSI at 62.76.
Weekly Up
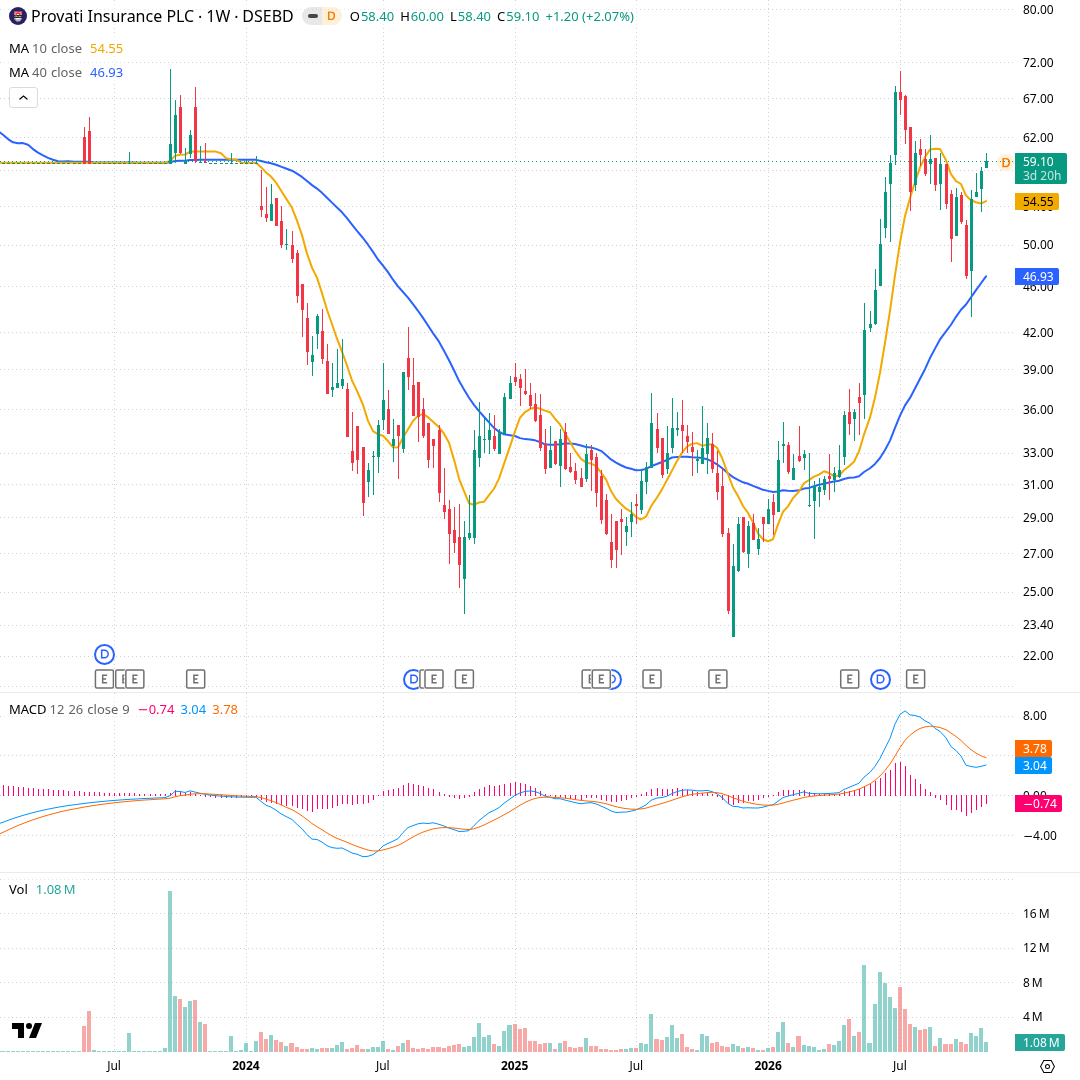
Each candle is one week. The orange line is the 10-week average (৳54.55) and the blue line the 40-week average (৳46.93); below are MACD, which compares a fast and slow average to show momentum, and weekly volume. The stock bottomed at ৳22.9 in November 2025, rallied to ৳70.8 in July 2026 on weekly volume up to about 10 million shares, then pulled back to ৳43.3 in October. Three straight up weeks followed, and price now sits above both averages. The MACD line (3.04) is below its signal (3.78).
Daily Up
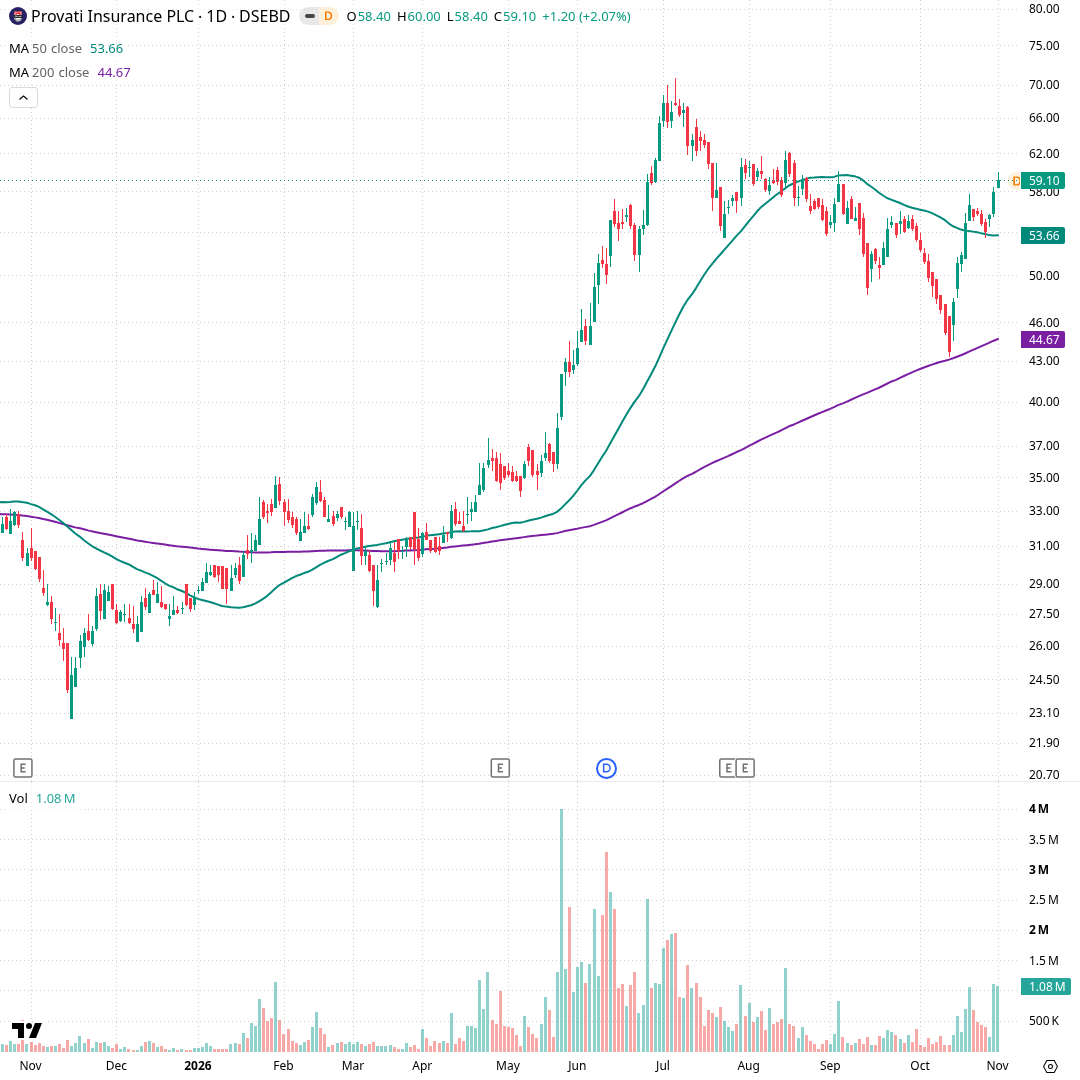
Each candle is one trading day, about the last year. The green line is the 50-day average (৳53.66) and the purple line the 200-day average (৳44.67); volume is shown below. Price rose from ৳27.9 in March to ৳70.8 in early July with daily volume reaching about 4 million shares. From August to mid-October it drifted lower, touching ৳43.3 on the 200-day line. Since then it has rebounded to ৳59.1, back above the flattening 50-day average, with the last two sessions trading over 1 million shares each.
Hourly Up
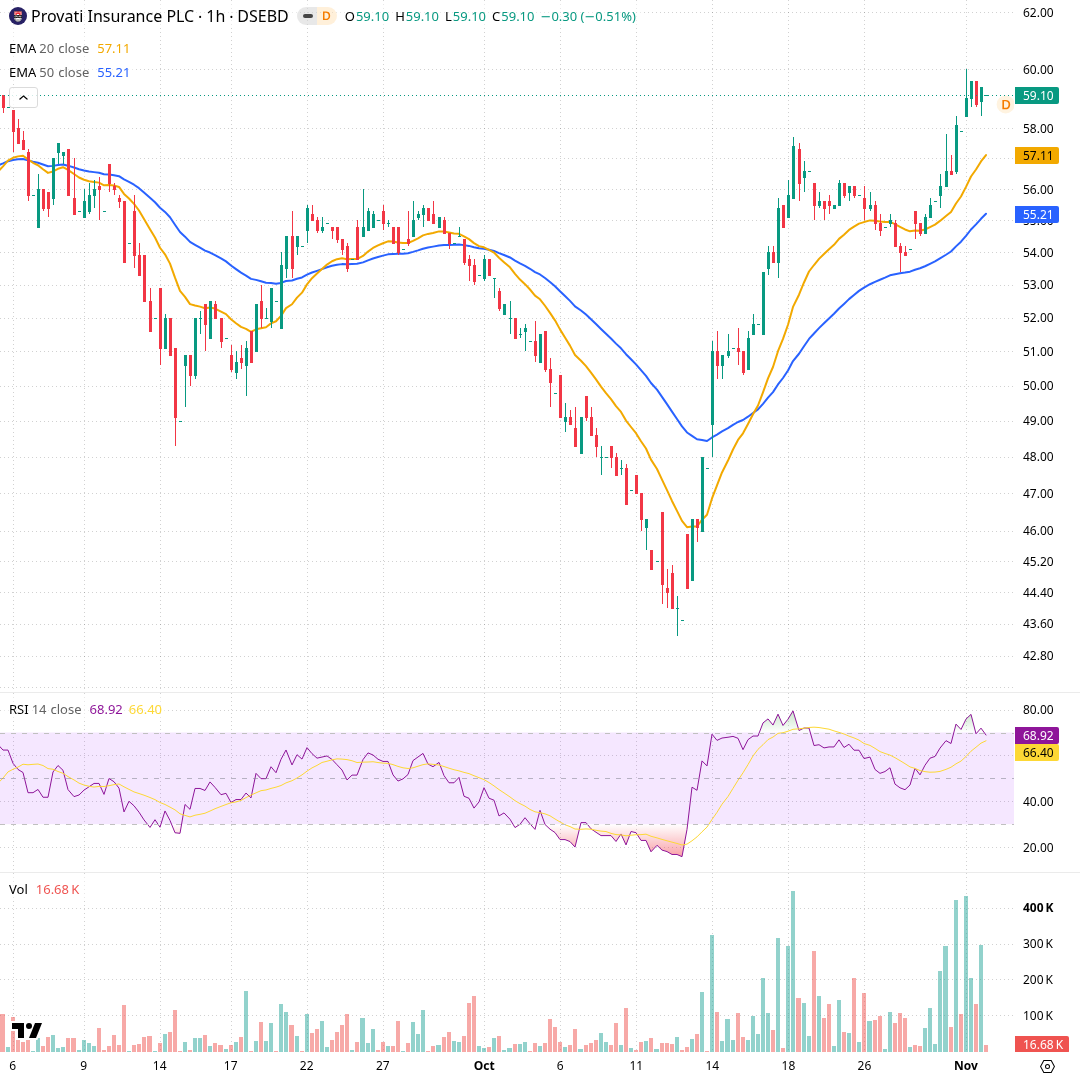
Each candle is one trading hour, covering roughly the last two months. The orange line is the 20-hour exponential average (৳57.11) and the blue line the 50-hour exponential average (৳55.21); RSI and hourly volume sit below. Price fell steadily from about ৳56 in late September to ৳43.3 on 12 October, then reversed sharply, reaching about ৳57.7 by 18 October. After a dip to ৳53.4 it climbed again to a high of ৳60.0 today. Both averages point up, and hourly RSI is 68.92.
Momentum and volume
Buying interest has picked up since mid-October. RSI has climbed from deeply oversold to 64, daily MACD has turned up above its signal line, and the latest sessions traded more than double average volume. ADX at 21 says the trend is not yet strong, and price is pressing against the upper Bollinger band.
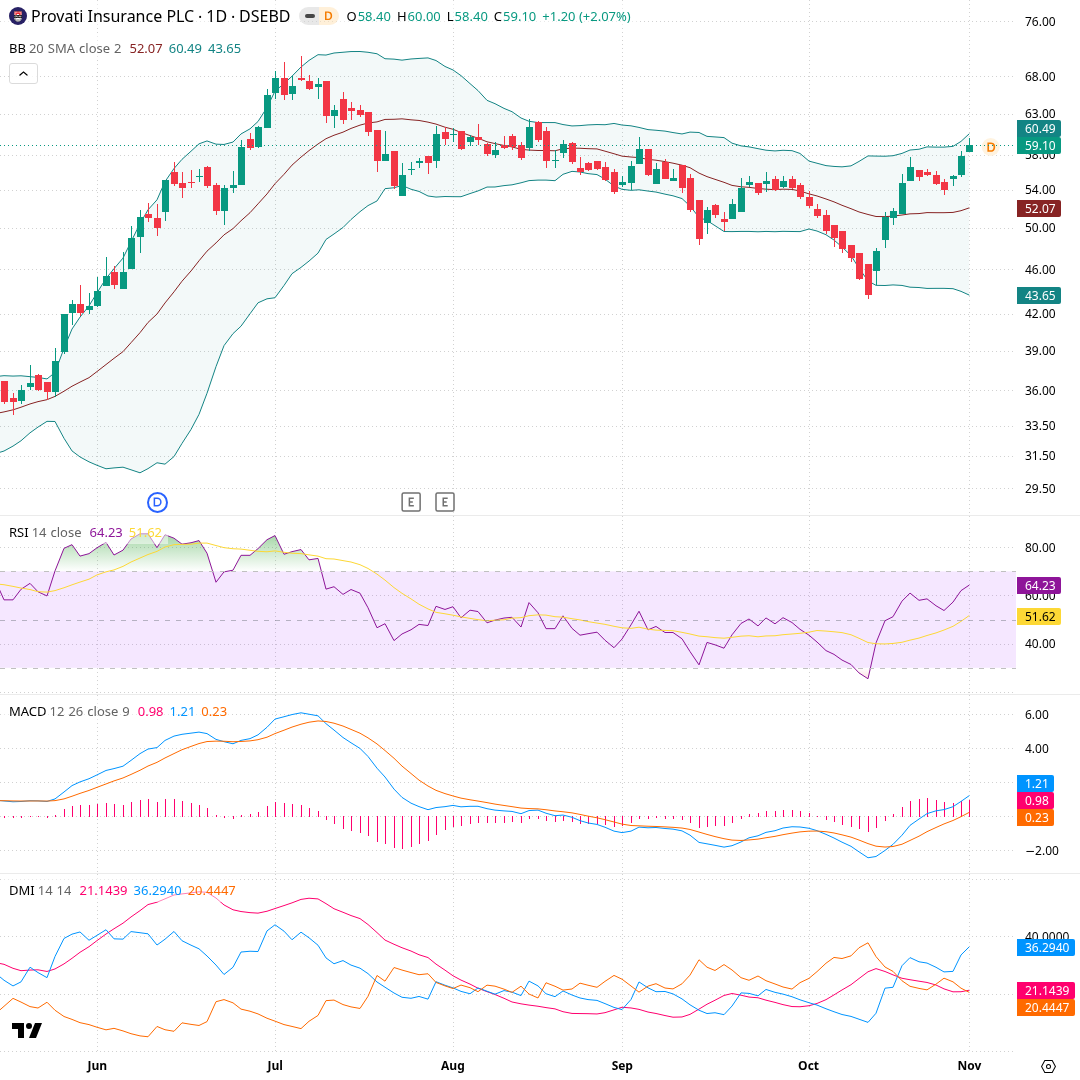
Each candle is one trading day over about six months. Bollinger Bands surround a 20-day average (৳52.07) with bands two standard deviations away (৳60.49 and ৳43.65). Below are RSI (14) at 64.23, MACD at 1.21 versus signal 0.23, and ADX/DMI, where ADX (21.1) measures trend strength and +DI (36.3) and -DI (20.4) show buying versus selling pressure. The June–July surge rode the upper band; from August to October price slid along the lower half, with RSI dipping near 25 in mid-October. Since then price has climbed back toward the upper band.
What would change the picture
Each scenario card names a price condition and what it would mean for the chart's structure if it happened. They are conditions to watch, not predictions, and none of them says which outcome is more probable.
Recent changes and what followed
Each row is a day a tracked signal changed, and the price move over the next 5, 20 and 60 trading days (blank until that many days have passed). Past moves do not predict future ones.
| Date | Change | Close | Next 5 days | Next 20 days | Next 60 days |
|---|---|---|---|---|---|
| 2026-10-29 | Closed above the nearest resistance level | ৳57.90 |
- Computed from daily closing prices (method t1, wording agent-2); history kept from 2026-10-29.
- Describes price history only. Not investment advice, not a rating or a price target.