Prime Bank PLC. (PRIMEBANK) technical report
As of the 2026-11-01 close. Updated every trading day. Company page · All DSE stocks: technical data
In plain words
Prime Bank's share price rose strongly through 2025, from about ৳24.76 in November 2025 to a peak of ৳34.38 in February 2026. Since March it has moved sideways, mostly between ৳27.9 and ৳31.3. In September and early October the price drifted down and sat quietly near ৳28. On 19 October a burst of buying, on 9.75 million shares (several times the usual), pushed it to ৳30.9. Over the last five sessions that jump has partly faded, and the price closed at ৳29.20 today. That puts it just under the 200-day average (the average closing price of the last 200 trading days, ৳29.69) and above the 50-day average (the last 50 days, ৳28.73). The levels that matter most are ৳29.69 and ৳31.3 above, and ৳28.73 and ৳27.9 below. The stock is about 15% below its 52-week high.
Key levels
Support is a price where buying has stopped falls before; resistance is where selling has capped rallies. For Prime Bank, ৳27.9–28.0 held repeatedly in September and October. On the upside, ৳30.9–31.3 capped the July highs and this month's spike. The 200-day average at ৳29.69 is the nearest line price is now testing from below.
Trend on each timeframe
The monthly chart still shows a long uptrend, with price resting on its 12-month average. The weekly picture is flat, with the shorter 10-week average below the 40-week. The daily chart is sideways between its two main averages, and the hourly chart has turned down since the late-October peak. Longer views are firmer than shorter ones.
Monthly Up
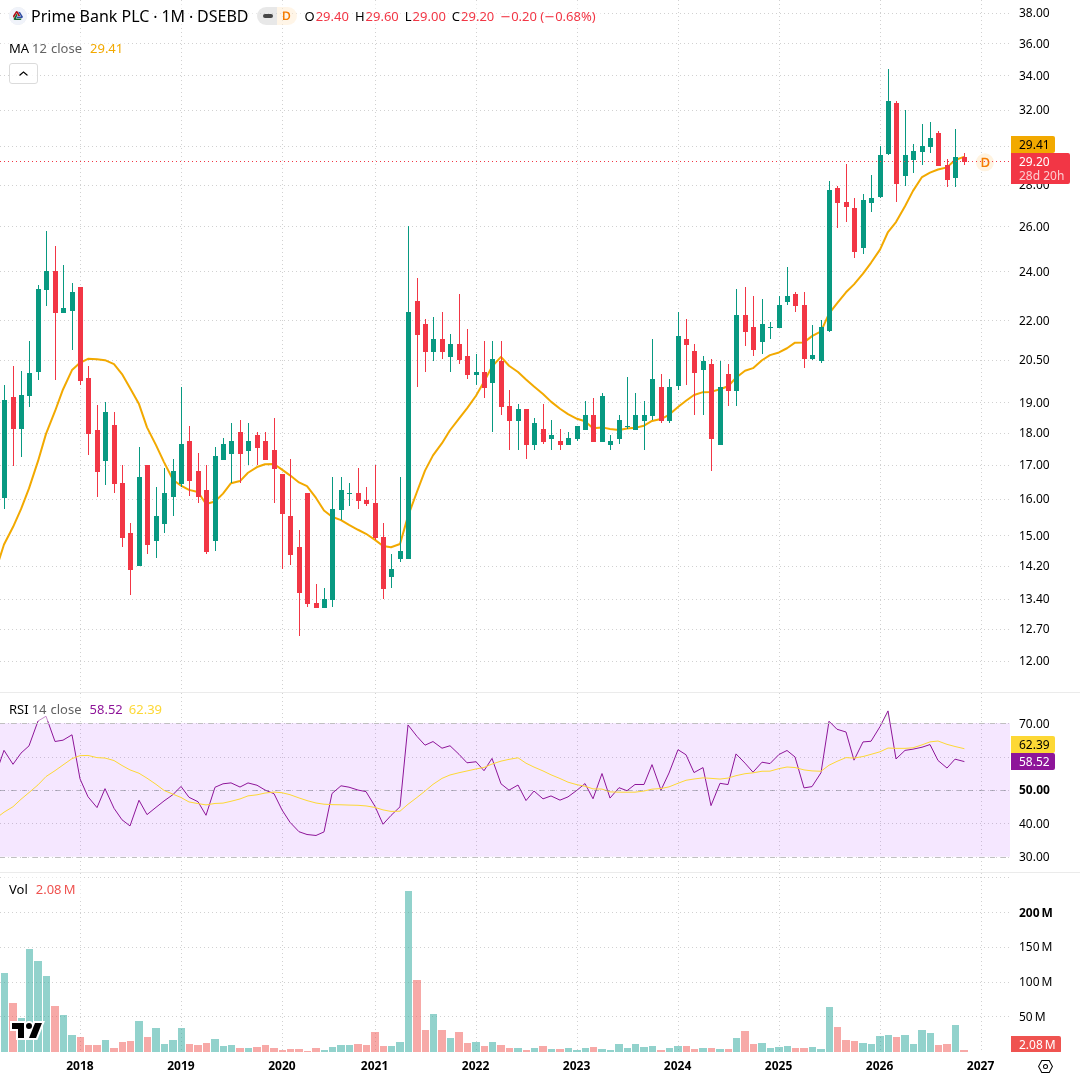
Each candle is one month, covering about ten years. The orange line is the 12-month simple average (average close of the last 12 months); the lower panel is RSI (14), a 0–100 momentum gauge, plus volume. Price climbed from the ৳13–14 area in 2020 to a ৳34.38 high in February 2026, then pulled back. It now sits at ৳29.20, almost exactly on the 12-month average of ৳29.41. Monthly RSI is 58.5, above the midpoint but well off its early-2026 peak.
Weekly Sideways
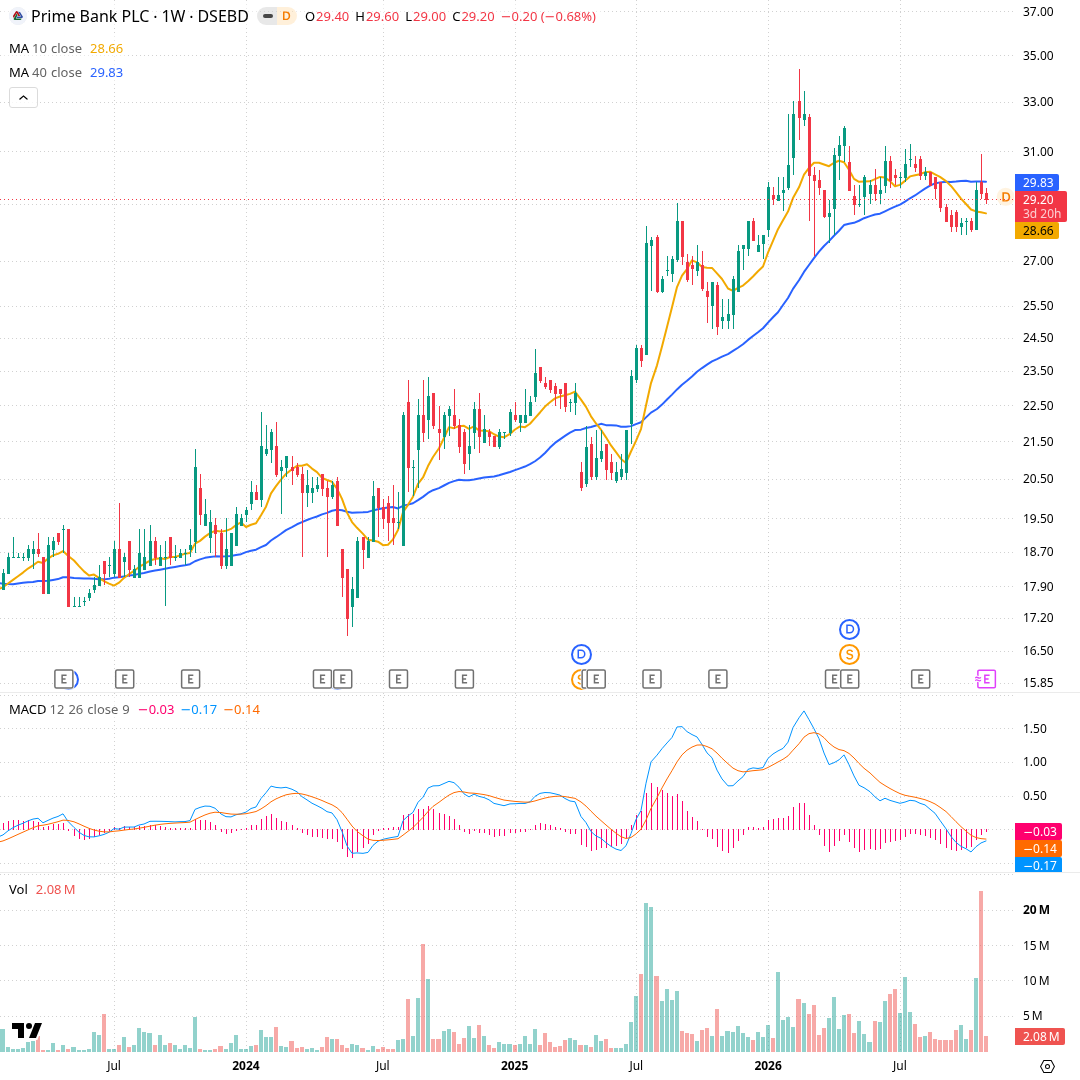
Each candle is one week, about four years in view. Orange is the 10-week average, blue the 40-week average; below are MACD (a trend-momentum measure based on the gap between two averages) and volume. The 2025 advance peaked at ৳34.38 in February 2026. Since then weeks have traded mostly between ৳27.9 and ৳31.3. The 10-week (৳28.66) is under the 40-week (৳29.83) and MACD sits just below zero at -0.17. Weekly volume hit about 22.7M shares in the week of 2026-10-25, the heaviest in the window.
Daily Sideways
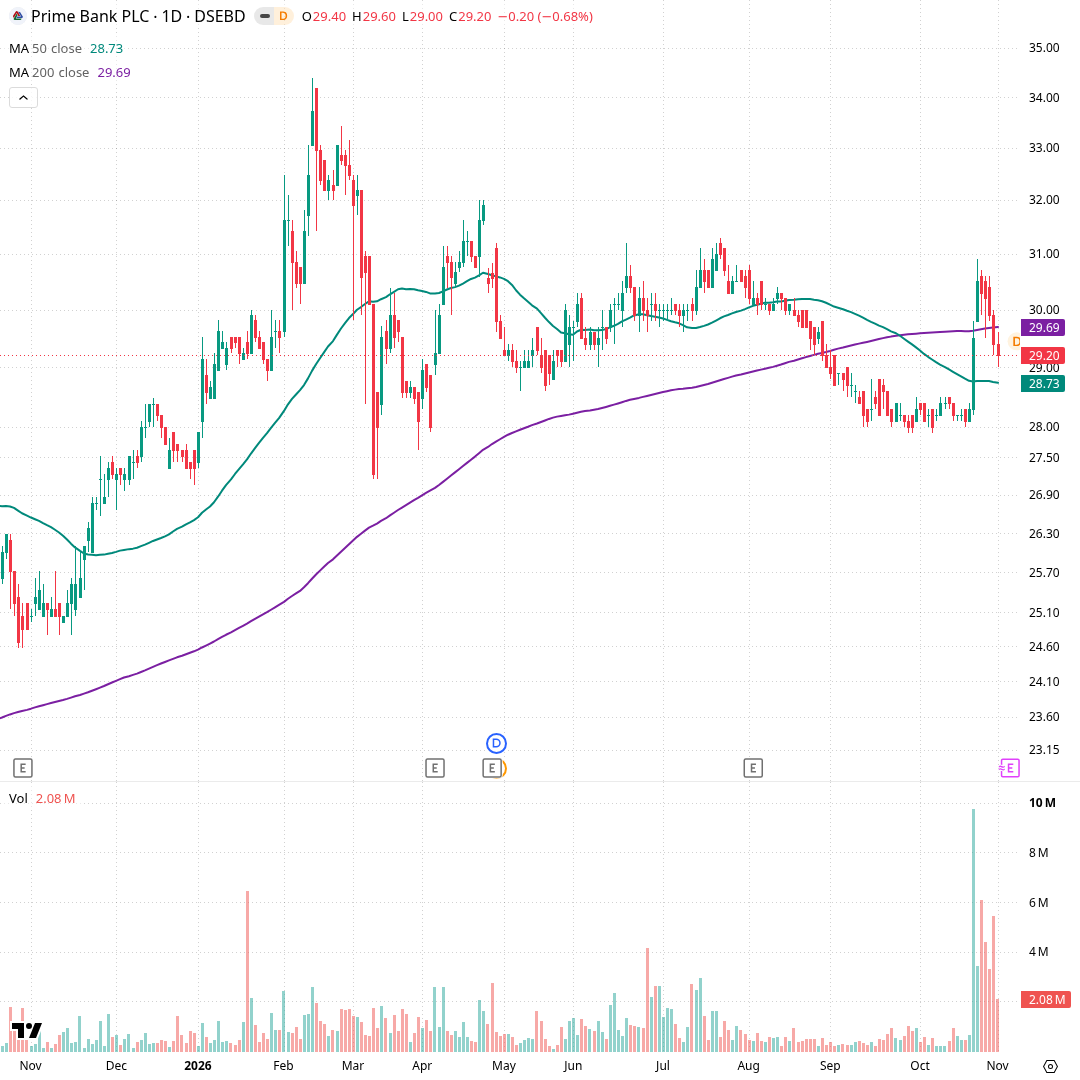
Each candle is one trading day, about one year in view. Green is the 50-day average, purple the 200-day average (average close of the last 200 sessions), with volume below. Price rose from ৳24.76 in November 2025 to ৳34.38 in February, then ranged. In September–October it based between ৳27.9 and ৳28.5, then jumped on 9.75M shares on 2026-10-19 to a ৳30.9 high. It has since slipped back to ৳29.20, below the 200-day (৳29.69) but above the 50-day (৳28.73).
Hourly Down
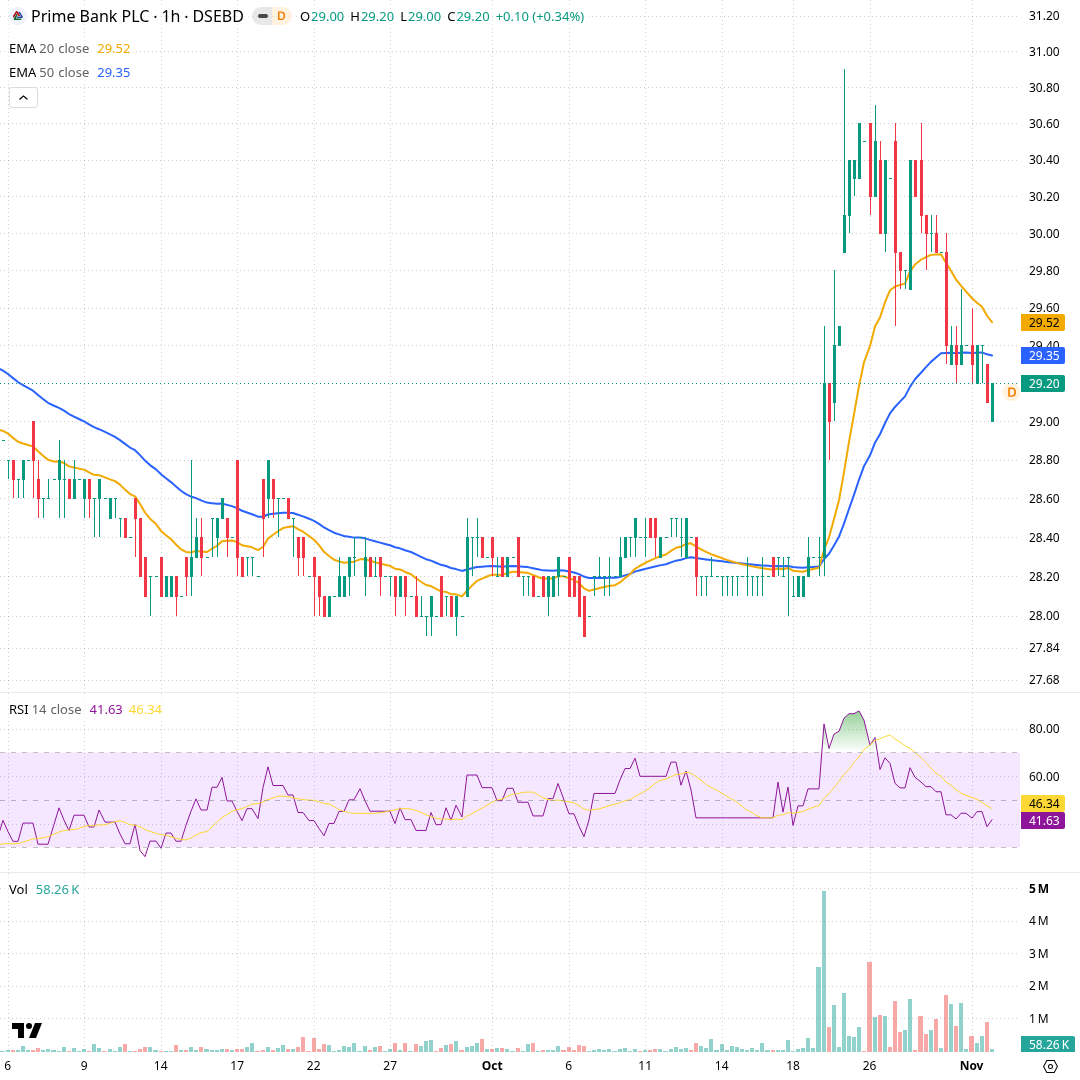
Each candle is one trading hour, covering roughly the last two months. Orange is the 20-hour exponential average, blue the 50-hour; RSI and volume are below. After weeks around ৳28.0–28.6, price surged in late October to ৳30.9 on the heaviest hourly volume in the window. It has since made lower highs and now trades at ৳29.20, under both averages (৳29.52 and ৳29.35). Hourly RSI is 41.6, below the midpoint.
Momentum and volume
Momentum surged with the October volume spike and has been cooling since. RSI dropped from about 78 to 53.5, a neutral reading. MACD is still positive but weakening, and trading volume is back near its normal level at 1.04 times average. Buying interest has faded after the burst.
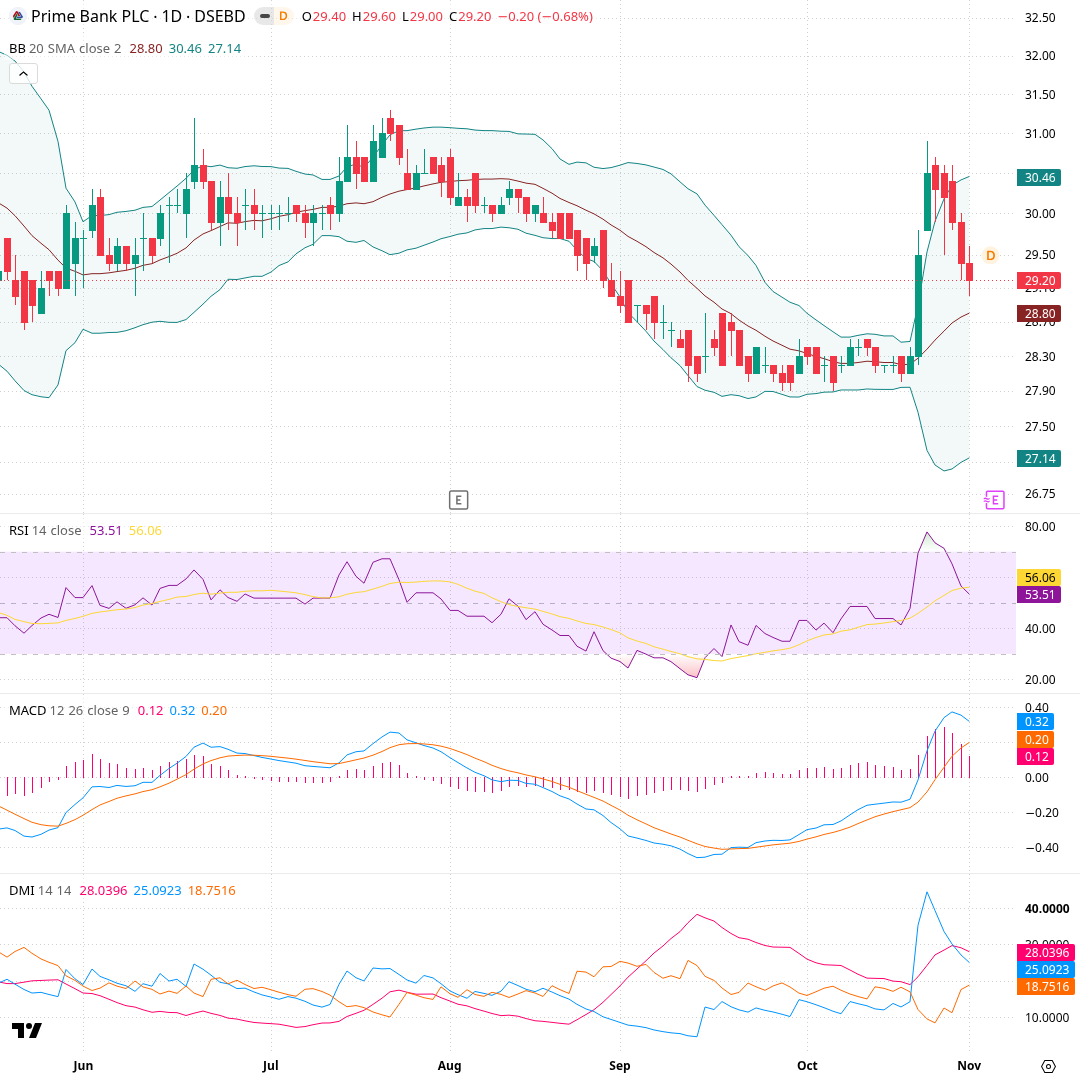
Each candle is one trading day over about six months. Bollinger Bands (a 20-day average with bands two standard deviations either side) frame the price; below are RSI, MACD and ADX/DMI (trend strength and direction). Bands squeezed tight in early October around ৳27.9–28.5, then price burst through the upper band on 2026-10-19. RSI hit about 78 and has eased to 53.5. MACD (0.32) is still above its signal (0.20) but the bars are shrinking. ADX is 28.0 with +DI 25.1 above -DI 18.8.
What would change the picture
The scenario cards list price conditions worth watching and what each would mean for the chart's structure. They are not predictions and do not say which will happen; they show which levels would change the picture if price closed beyond them.
- Computed from daily closing prices (method t1, wording agent-2); history kept from 2026-11-01.
- Describes price history only. Not investment advice, not a rating or a price target.