Nahee Aluminum Composite Panel PLC. (NAHEEACP) technical report
As of the 2026-11-01 close. Updated every trading day. Company page · All DSE stocks: technical data
In plain words
Nahee Aluminum fell for most of 2024 and 2025, reaching ৳13.9 in November 2025. From February 2026 it rose quickly, nearly tripling to ৳42.0 in June, and touched ৳42.0 again in July. It then slipped to ৳29.5 by mid-September. Since then each dip has stopped higher than the one before, and the last close of ৳40.10 is the highest since July, on 2.09 million shares, about 2.3 times the usual daily volume. The price is above its 50-day average (the average closing price of the last 50 trading days, ৳34.81) and its 200-day average (the same over 200 days, ৳28.94), and both are rising. The key level above is ৳42.0, the twice-tested high. Below, ৳35.7 (the October 25 low) and ৳29.5 (the September low) mark the recent floors.
Key levels
Support is a price where buying has previously stopped a fall; resistance is where selling has stopped a rise. On Nahee, ৳42.0 turned the price back in both June and July. On the way down, ৳29.5 held in September, and since then lows at ৳33.6 and ৳35.7 have each held above the last one.
Trend on each timeframe
The monthly chart shows a recovery from a long decline, with price above a rising 12-month average. The weekly picture is positive but its MACD is level with the signal line, showing slower momentum than in spring. The daily and hourly charts are the strongest: rising lows, price above all averages, and a heavy-volume push to ৳40.8.
Monthly Up
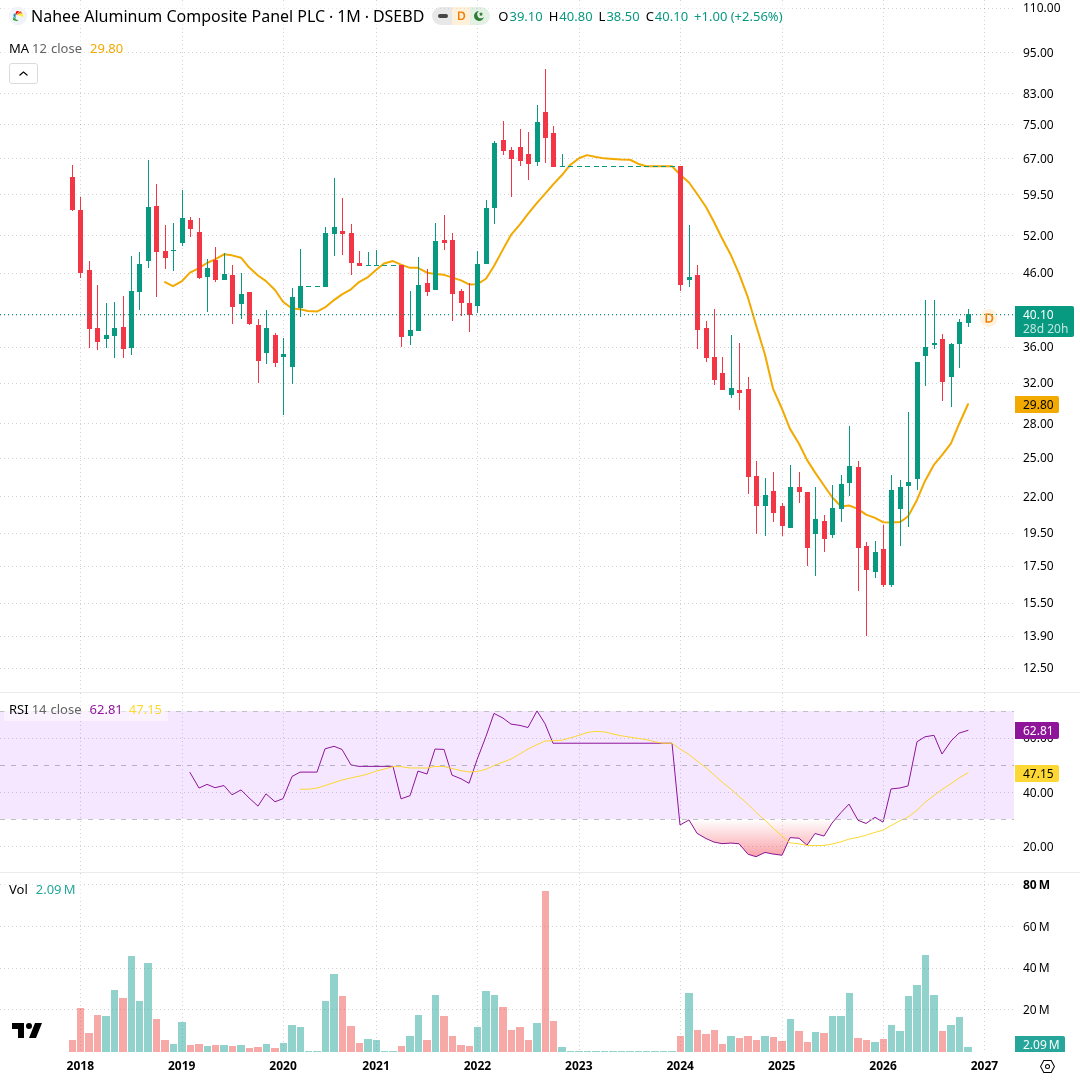
One candle is one month, covering about nine years. The orange line is the 12-month simple average (৳29.80), the panel below is RSI(14), and the bottom is volume. The stock peaked at ৳89.9 in 2022, then fell through 2024 and 2025 to ৳13.9 in November 2025. From February 2026 it rose sharply, with May and June the heaviest months (31.5 and 45.9 million shares) and a June high of ৳42.0. October closed at ৳39.1. Monthly RSI is 62.8, up from below 30 during the decline.
Weekly Up
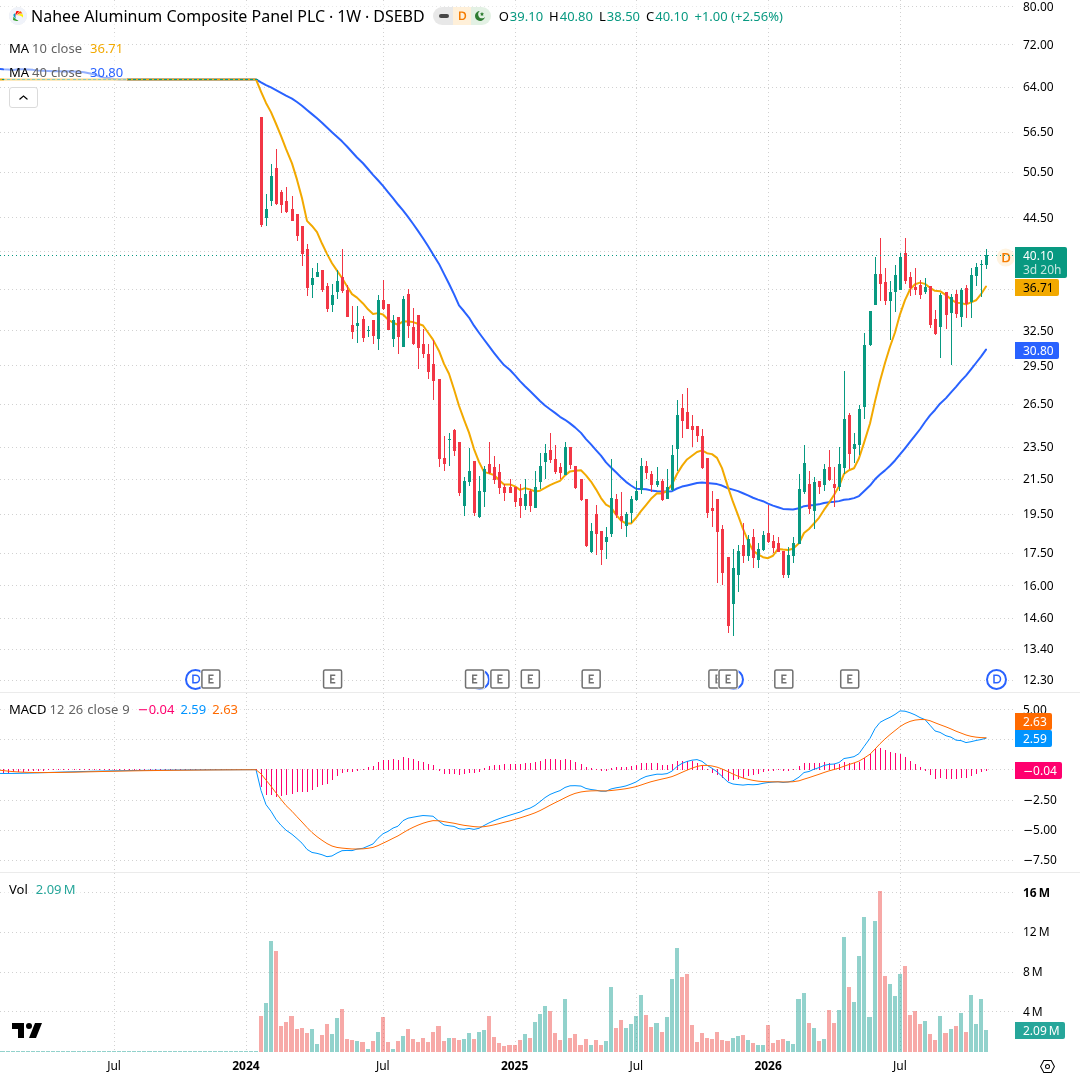
One candle is one week. The orange line is the 10-week average (৳36.71), the blue the 40-week average (৳30.80); MACD and volume are below. After a 2024–25 slide the stock based near ৳16–৳18, then rallied from February 2026 to a ৳42.0 high in June on weekly volume up to 16.1 million. July to September saw a pullback to ৳29.5, and since mid-October weekly closes have risen to ৳37.9, ৳38.8, ৳39.1 and now ৳40.1. Weekly MACD is roughly level with its signal line.
Daily Up
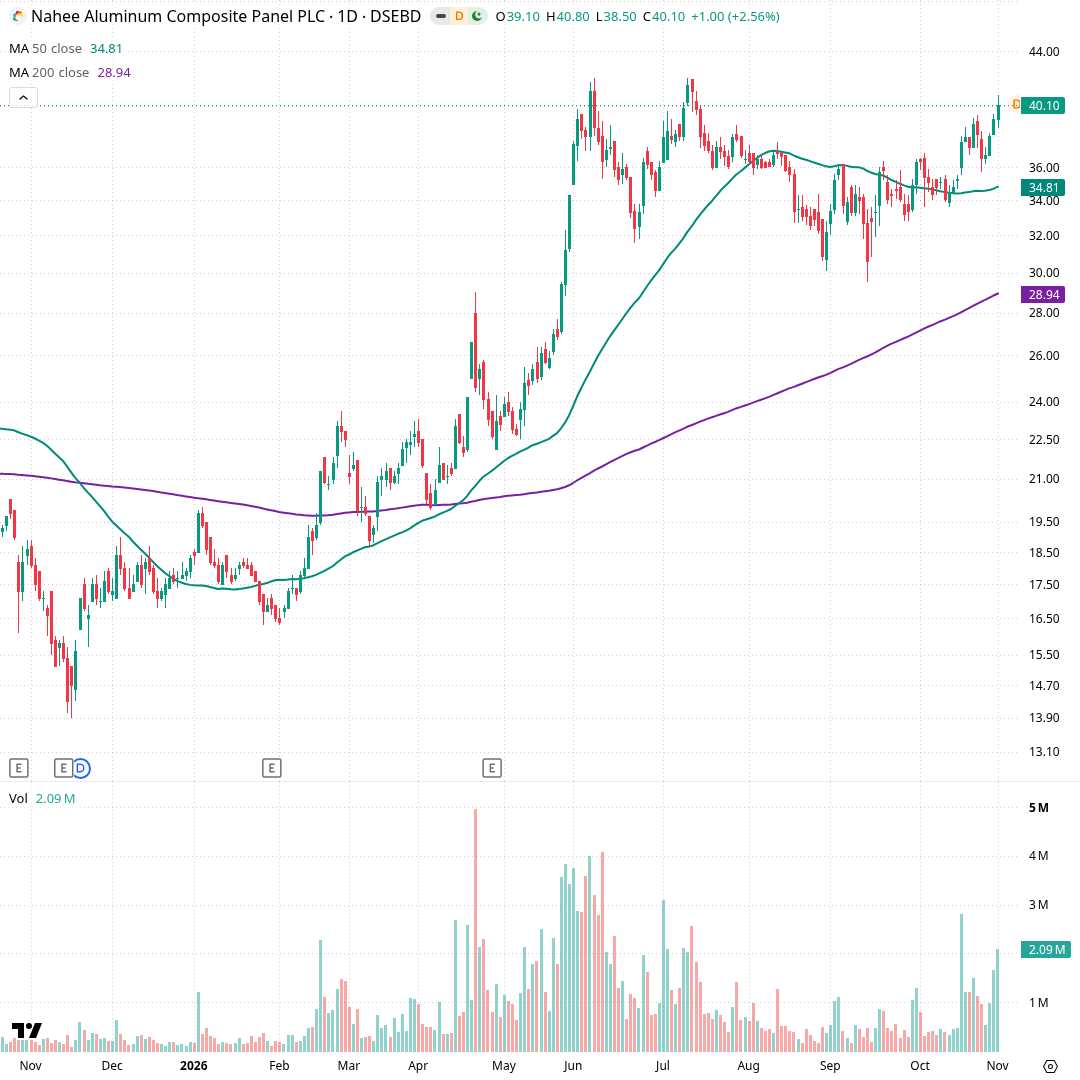
One candle is one trading day, about the last year. The green line is the 50-day average (৳34.81) and the purple the 200-day average (৳28.94); volume is below. Price ran from ৳16.3 in February to ৳42.0 on June 8 and again on July 12, then slid to ৳29.5 on September 14. Since then the lows have risen: ৳32.8 late September, ৳33.6 early October, ৳35.7 on October 25. The last close, ৳40.10, came on 2.09 million shares. The 50-day line has flattened and turned up; the 200-day keeps rising.
Hourly Up
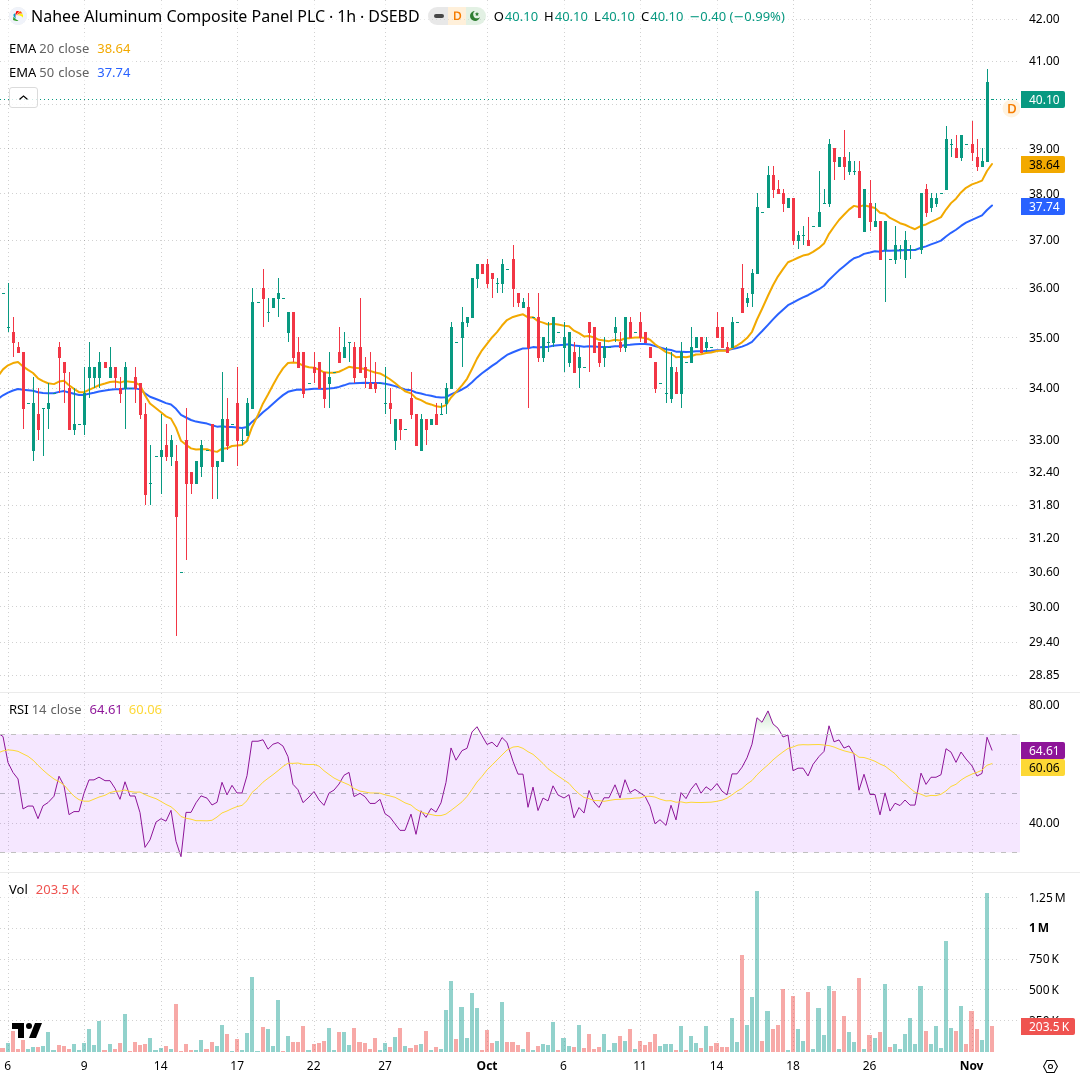
One candle is one trading hour, about the last two months. The orange line is the 20-hour exponential average (৳38.64), the blue the 50-hour (৳37.74); RSI(14) and volume are below. Price dipped to ৳29.5 on September 14, steadied around ৳33–৳36 into mid-October, then stepped up on October 13 with 1.30 million shares in one hour. In the last session, a late hour lifted price from ৳38.7 to ৳40.8 on 1.29 million shares. Hourly RSI is 64.6.
Momentum and volume
Momentum is improving. RSI, a 0–100 gauge of recent gains vs losses, is 66 and rising. MACD is above its signal line. Trading activity picked up, with 2.27 times average volume. ADX, which measures trend strength, is only 16, so the move is still young, and price is at the edge of its Bollinger band, a stretched short-term position.
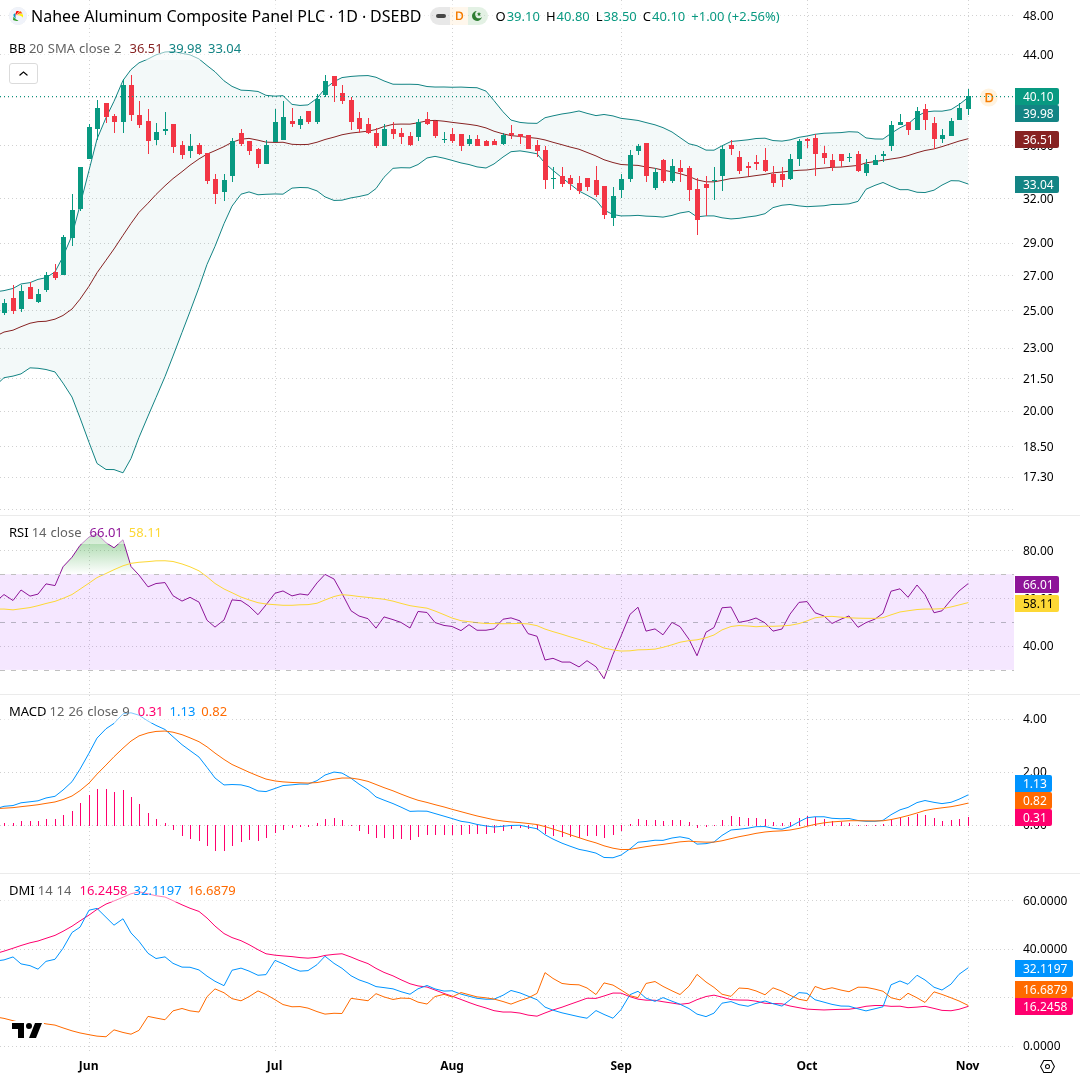
One candle is one day, roughly June to November 2026. The shaded channel is the Bollinger Bands: a 20-day average (৳36.51) with bands at ৳39.98 above and ৳33.04 below. Below are RSI(14) at 66.0, MACD at 1.13 vs signal 0.82, and ADX at 16.2 with +DI 32.1 and −DI 16.7. The bands were very wide in the June surge and narrowed through August to October. RSI dipped near 30 in early September and has climbed since. MACD crossed above its signal in late September and keeps rising; the latest close sits just above the upper band.
What would change the picture
The scenario cards are conditions to watch, not forecasts. Each describes what a given daily close would mean for the chart, such as a close above the ৳42.0 ceiling or below an earlier low. They do not say which will happen and are not trading advice.
- Computed from daily closing prices (method t1, wording agent-2); history kept from 2026-11-01.
- Describes price history only. Not investment advice, not a rating or a price target.