Mir Akhter Hossain Limited (MIRAKHTER) technical report
As of the 2026-11-01 close. Updated every trading day. Company page · All DSE stocks: technical data
In plain words
Mir Akhter's share price has been falling for most of the past five months. After a sharp rally from about ৳25 in April to a high of ৳48.70 in early June 2026, the price drifted lower through the summer and autumn. On 27 October it dropped 12.4% in a single day, from ৳29.00 to ৳25.40, on much heavier trading than usual, and it has kept slipping since, closing at ৳24.10 today. That is the lowest close in more than a year and close to the ৳23.60 low last seen in May 2025. The price is now well below the 50-day average (the average closing price of the last 50 trading days, ৳32.76) and the 200-day average (৳34.56), which shows the longer trend is down. The levels that matter most now are ৳23.60 underneath and the ৳25.50–26.00 and ৳29–30 zones above.
Key levels
Support is a price where buyers have stepped in before; resistance is where sellers have. For Mir Akhter, ৳23.60–24.00 held as a floor in May and November 2025 and was touched again today. Above, ৳25.50–26.00 capped the bounce after the gap, and ৳29.00–30.30 was the old floor that broke on 27 October.
Trend on each timeframe
All four views point the same way. The monthly chart shows the June rally fully reversed, the weekly price is under both its 10- and 40-week averages, the daily price is under its 50- and 200-day averages, and the hourly price is below both short averages. The only difference is that daily and hourly momentum are already deeply stretched.
Monthly Down
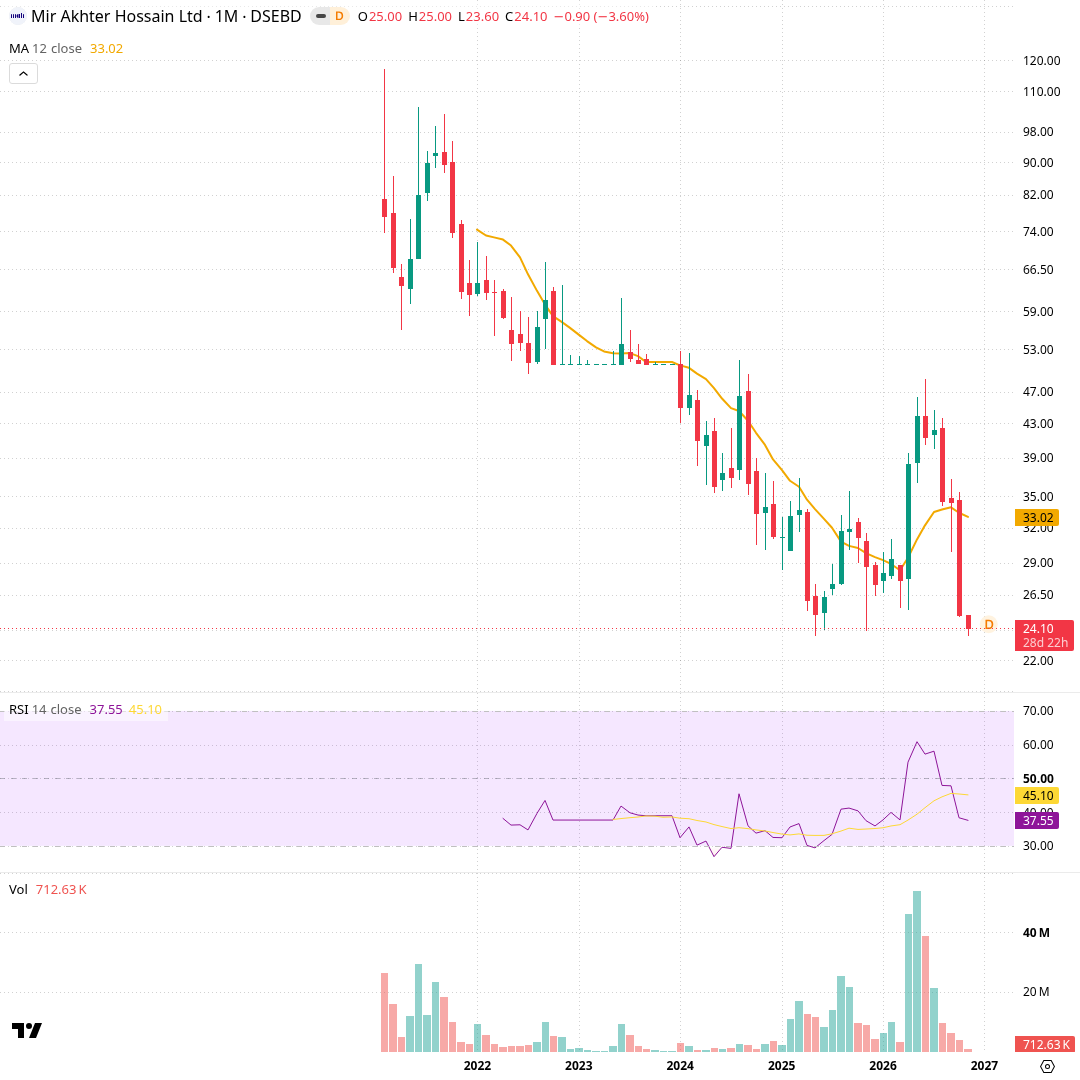
Each candle is one month, from the 2021 listing to November 2026. The orange line is the 12-month simple average (৳33.02), the average close of the last year. The lower panel is RSI 14 (37.55), a 0–100 gauge of recent gains versus losses, then volume. Price fell from ৳117.00 in 2021 to ৳23.60 in May 2025, jumped to a ৳48.70 high in June 2026 on monthly volume up to 54 million shares, and has since given it all back to ৳24.10.
Weekly Down
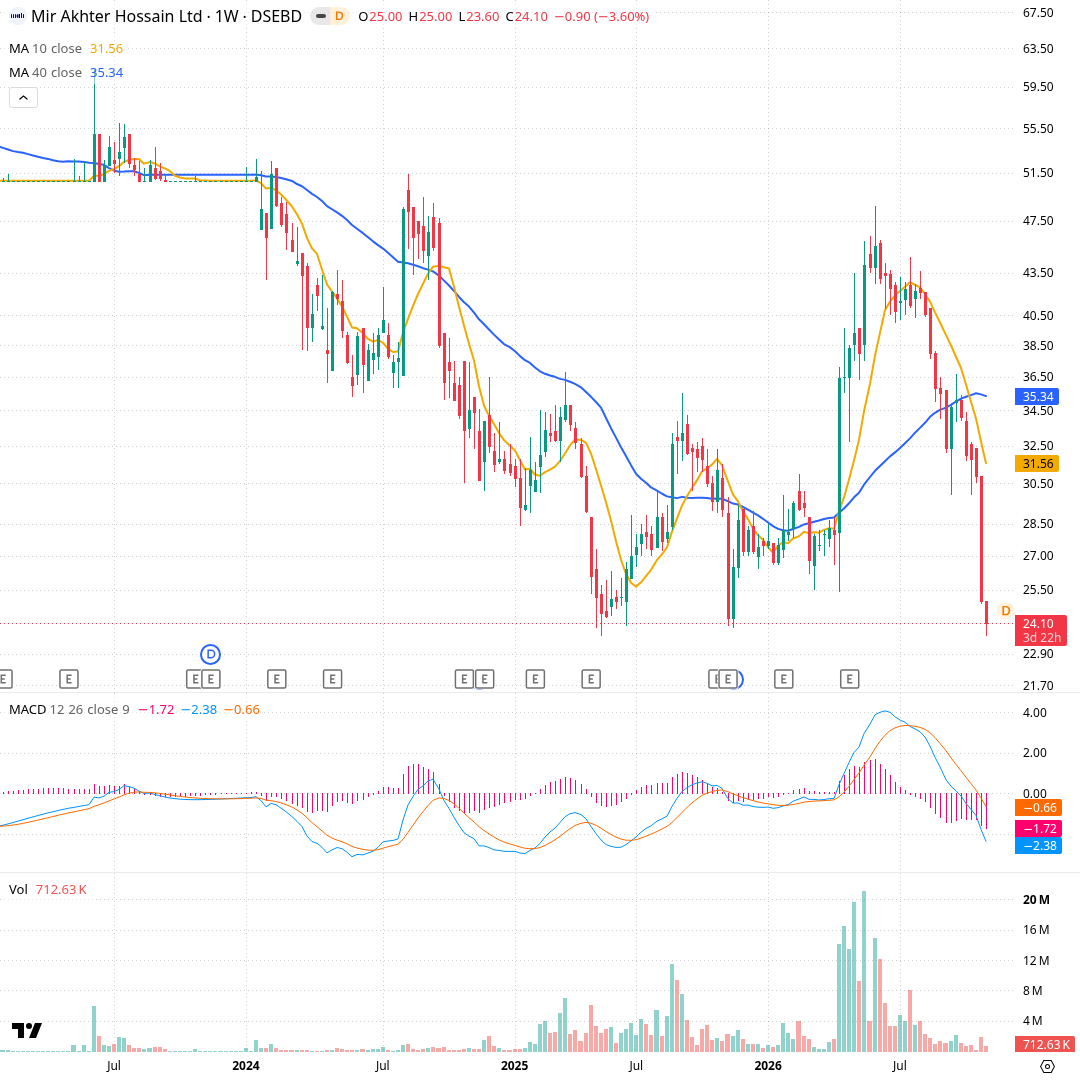
Each candle is one week, covering about four years. The orange line is the 10-week average (৳31.56) and the blue line the 40-week average (৳35.34). MACD below compares two moving averages to show momentum; it reads -2.38 against a signal of -0.66. Price peaked at ৳48.70 in early June, slid through both averages in August–September, and the week of 26 October fell from ৳30.90 to ৳25.00. This week closed at ৳24.10 so far.
Daily Down
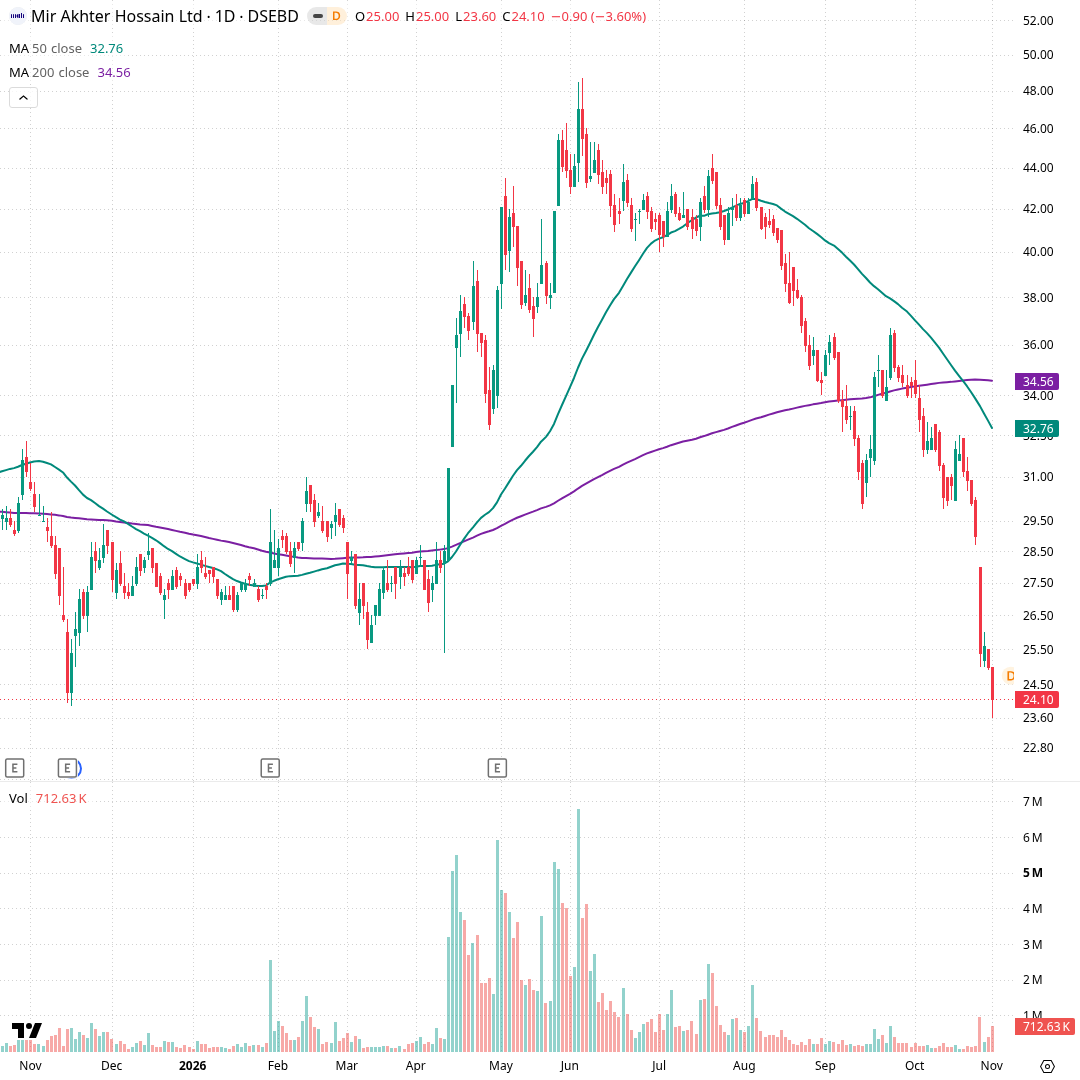
Each candle is one trading day, covering about a year. The green line is the 50-day average (৳32.76) and the purple line the 200-day average (৳34.56). Price rallied from ৳25.40 in April to ৳48.70 in June on daily volume up to 6.8 million shares, then declined steadily. A late-September bounce stalled at ৳36.70. On 27 October price gapped from ৳29.00 to ৳25.40 on 943,330 shares, and it closed today at ৳24.10 after a low of ৳23.60.
Hourly Down
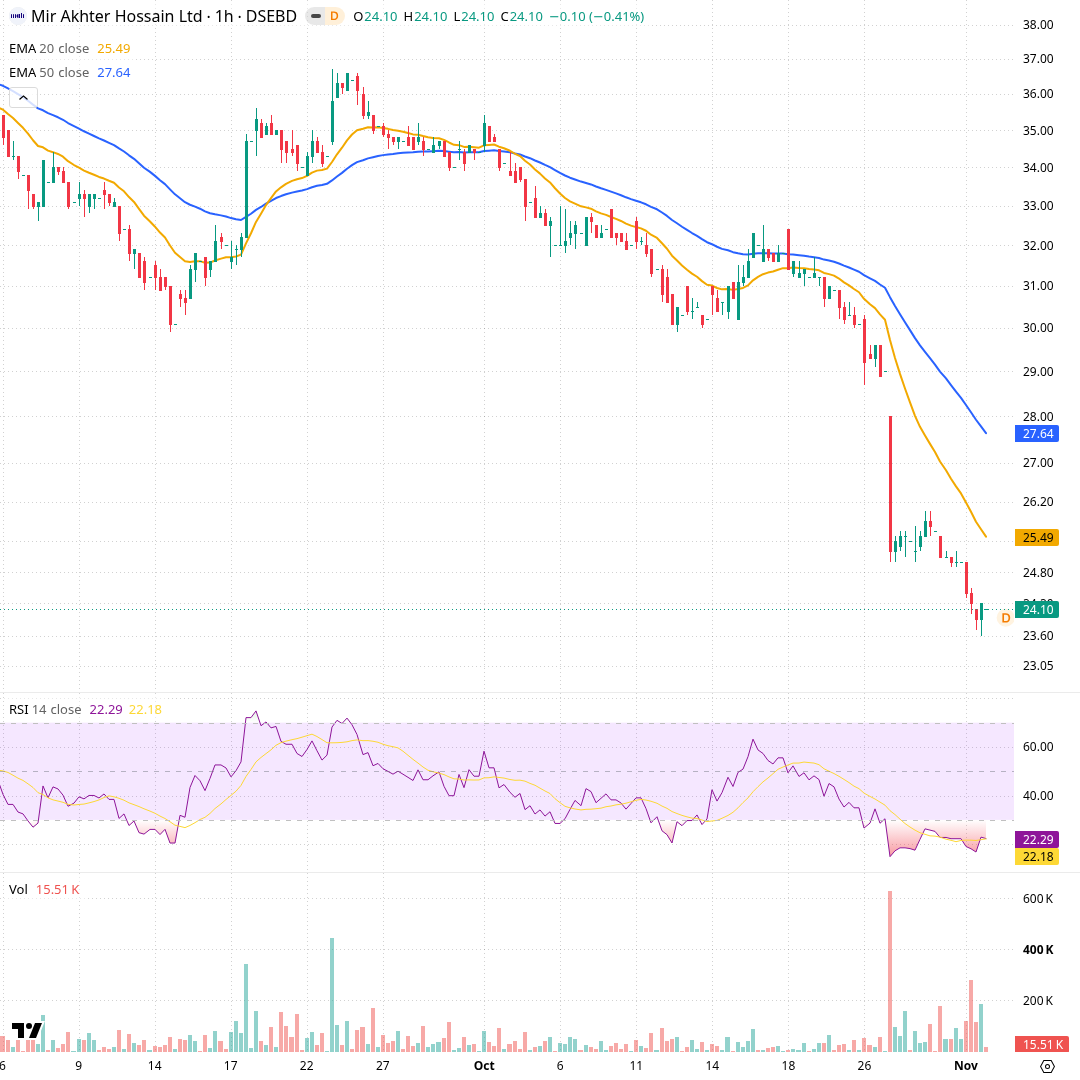
Each candle is one hour of trading, covering about eight weeks since early September. The orange line is the 20-hour exponential average (৳25.49) and the blue line the 50-hour average (৳27.64). RSI below reads 22.29. Price faded from ৳36.70 on 22 September to around ৳30 by mid-October, then the 27 October open dropped from ৳28.00 to ৳25.00 on 629,211 shares in the first hour. A small ৳25–26 shelf gave way today, with a low of ৳23.60.
Momentum and volume
Selling pressure has been strong and steady. Daily RSI at 20.7 is in the oversold zone, meaning recent losses heavily outweigh gains. MACD is negative and still falling, and ADX at 34.6 says the downtrend is strong. Today's volume was about three times the average, so the latest drop came with heavy trading.
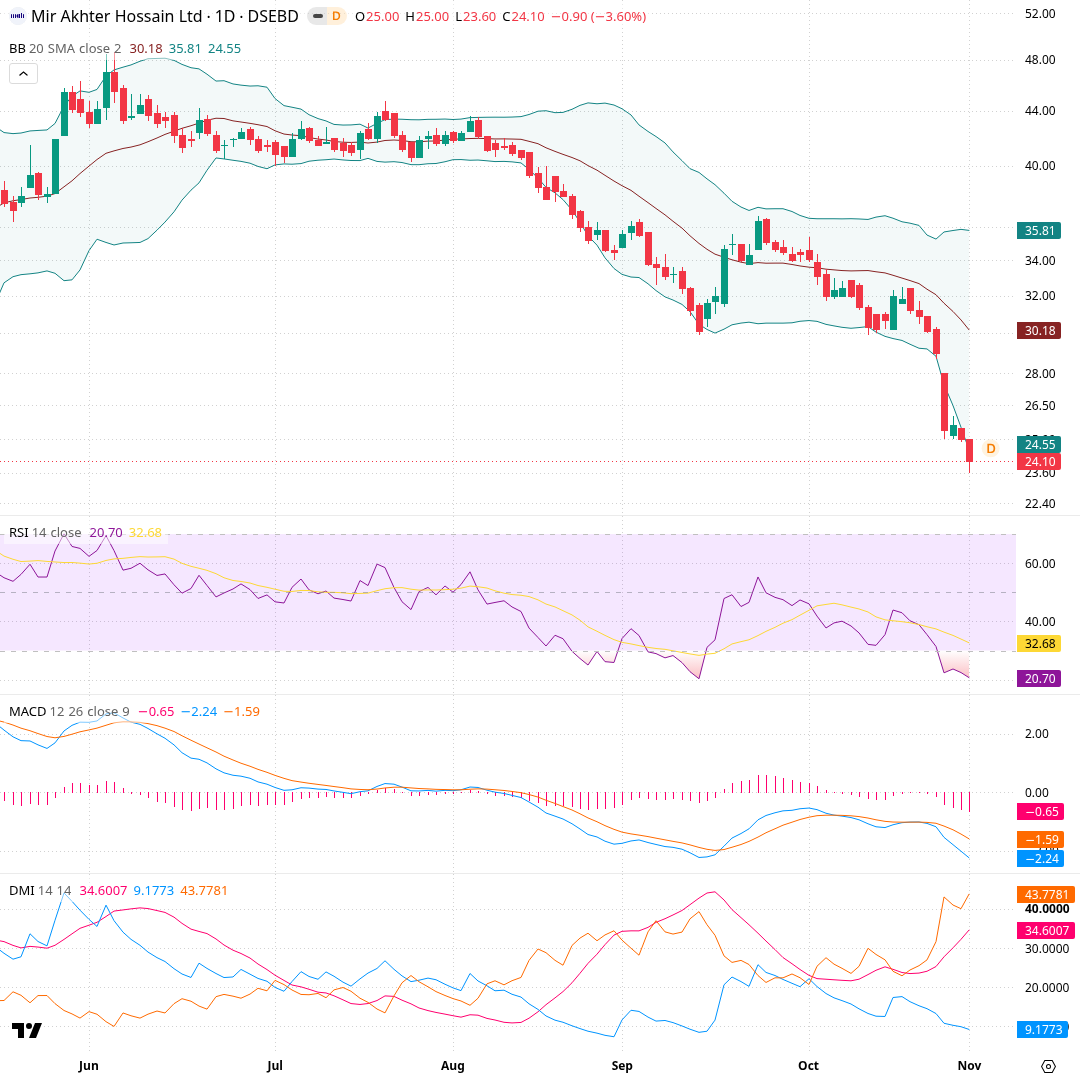
Each candle is one day, from late May to 1 November. Bollinger Bands are drawn around a 20-day average (৳30.18) at two standard deviations; the upper band is ৳35.81 and the lower ৳24.55. Price has hugged the lower band since August and closed below it today. RSI 14 is 20.70, under the 30 oversold line. MACD is -2.24 against a -1.59 signal. In the DMI panel, ADX is 34.60 with -DI at 43.78 and +DI at 9.18, a strong downtrend reading.
What would change the picture
The scenario cards describe what certain closing prices would mean for the chart's structure. They are conditions to watch, not predictions; none of them says what the price will do, only how the picture would change if that level were crossed.
Recent changes and what followed
Each row is a day a tracked signal changed, and the price move over the next 5, 20 and 60 trading days (blank until that many days have passed). Past moves do not predict future ones.
| Date | Change | Close | Next 5 days | Next 20 days | Next 60 days |
|---|---|---|---|---|---|
| 2026-11-01 | New 52-week closing low | ৳24.10 | |||
| 2026-11-01 | Volume three times or more its 20-day average | ৳24.10 |
- Computed from daily closing prices (method t1, wording agent-2); history kept from 2026-11-01.
- Describes price history only. Not investment advice, not a rating or a price target.