Miracle Industries Limited (MIRACLEIND) technical report
As of the 2026-11-01 close. Updated every trading day. Company page · All DSE stocks: technical data
In plain words
Miracle Industries' share price has spent most of the past two years moving sideways in a wide band, roughly ৳23 to ৳41. This year it peaked at ৳36.40 in February, fell to ৳25.00 in April, traded around ৳27–৳33 through the summer, then slipped to ৳24.20 in early October, the lowest in a year. Since then it has risen sharply, reaching ৳31.10 today, a gain of about 28%. Much more stock than usual changed hands: about four times the normal daily amount. Price is now above both the 50-day average (the average closing price of the last 50 trading days), ৳27.09, and the 200-day average (the average of the last 200 days), ৳28.68. The levels that matter are ৳32.90 (the August high) and ৳36.40 above, and ৳30.40 and ৳28.10–৳28.70 below.
Key levels
Support is a price where buyers have stepped in before; resistance is where selling has stopped rises. On Miracle Industries, ৳32.90 capped the August rally, and today's push reached ৳32.20 before easing. Below, ৳28.10–৳28.70 marks the 25 October breakout close and the 200-day average. ৳24.20, October's low, is where this rally began.
Trend on each timeframe
The daily and hourly charts both point up, with price above all their averages. The weekly chart has just turned: price is back above the 40-week line and MACD has crossed up. The monthly chart is still a sideways range, so the long-term picture has not changed as much as the short-term one.
Monthly Sideways
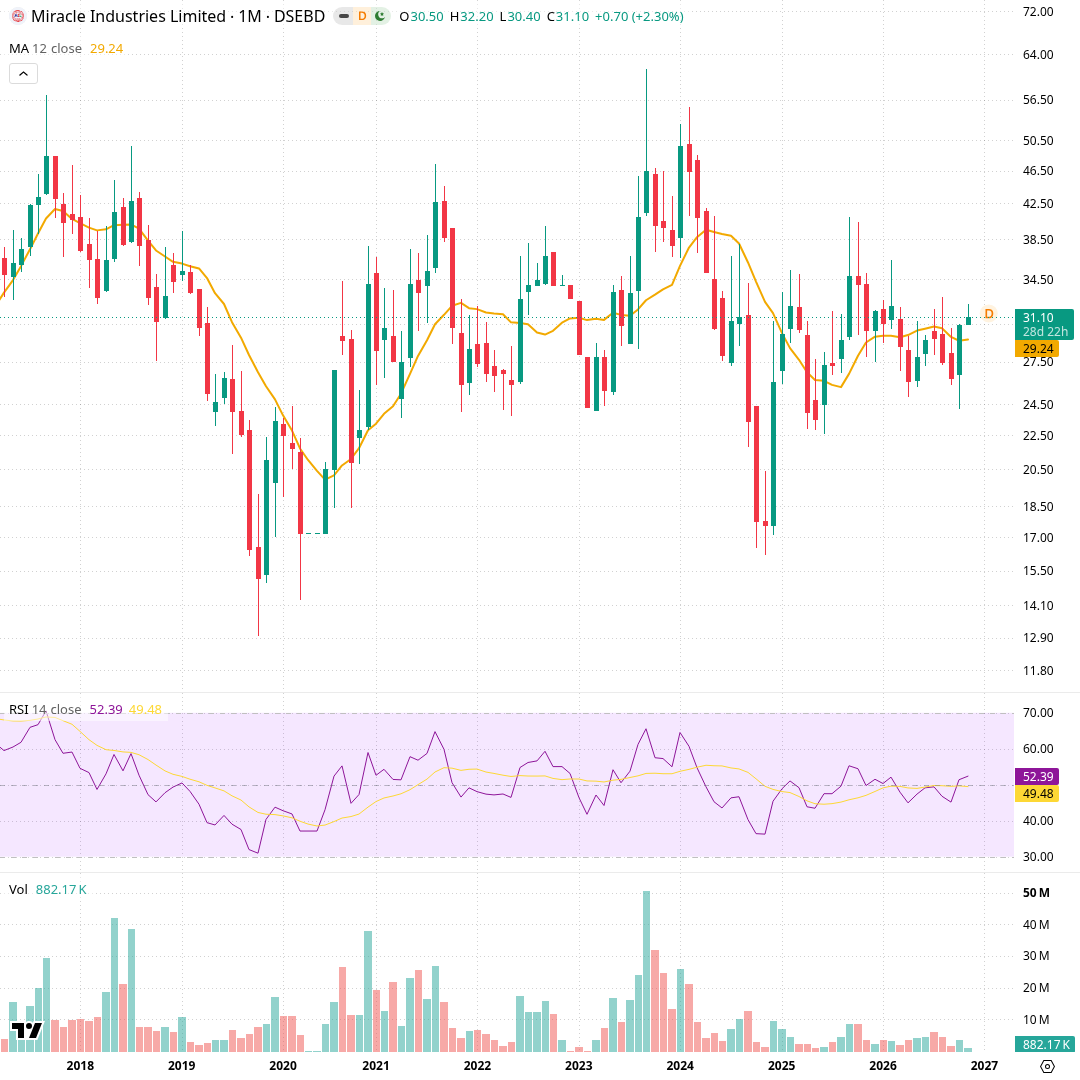
About ten years of monthly candles; one candle is one month. Orange is the 12-month average (৳29.24), RSI (14) is below, and volume at the bottom. The stock swung through wide ranges: peaks near ৳61 in 2023, a fall to about ৳16 in late 2024, then a recovery. Since early 2025 it has moved sideways, mostly between ৳23 and ৳41, around a flat average. November opened at ৳30.50 and is at ৳31.10, above the average. Monthly RSI is 52.4, mid-range.
Weekly Sideways
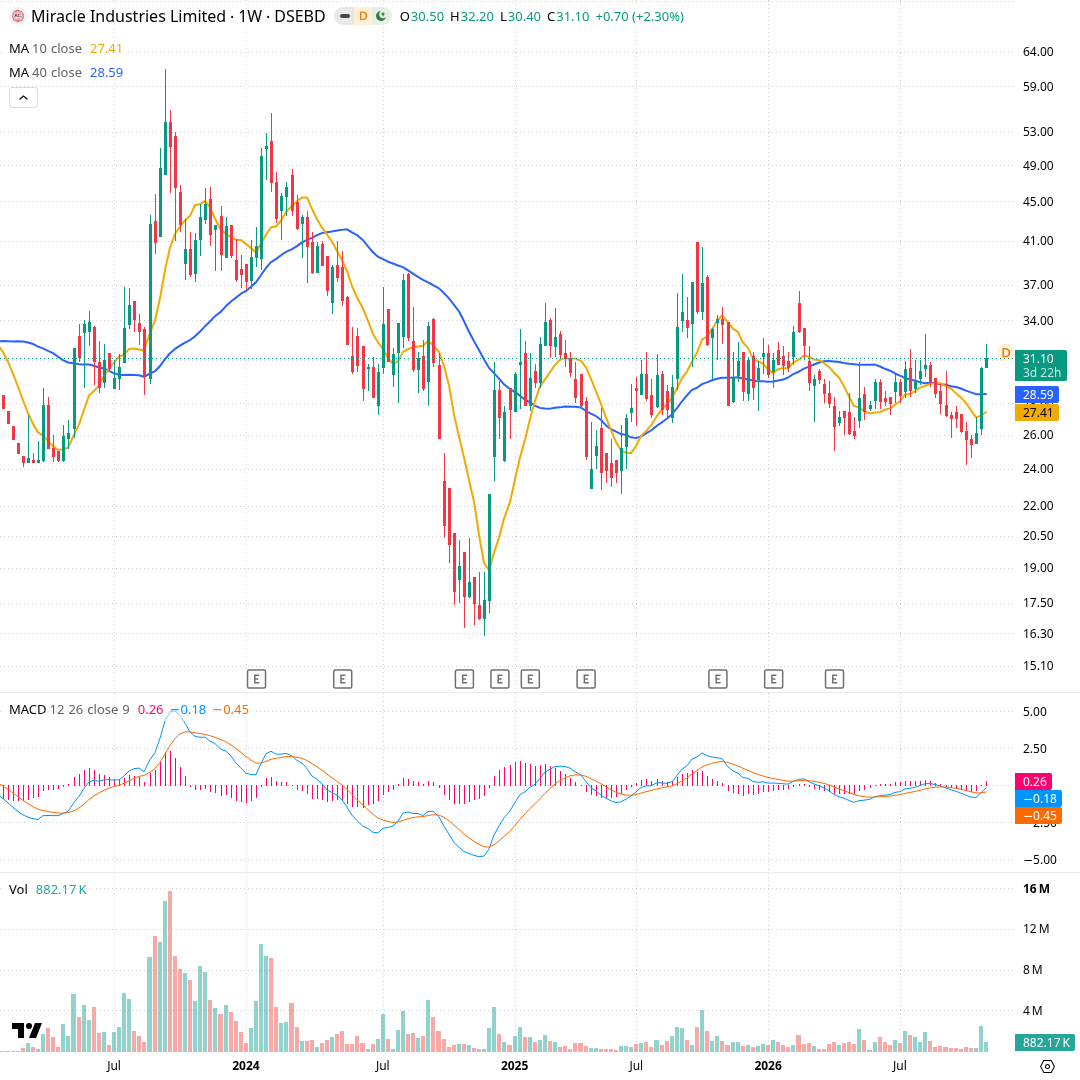
About four years of weekly candles; one candle is one week. Orange is the 10-week average (৳27.41), blue the 40-week (৳28.59); MACD and volume are below. After a 2024 collapse to ৳16, price recovered and has ranged roughly ৳25–৳41 since. September–October 2026 drifted down to a ৳24.20 low, then the week of 25 October jumped from ৳26.40 to ৳30.40 on 2.45 million shares, the heaviest week since July. This week is at ৳31.10. MACD (-0.18) has crossed above its signal (-0.45).
Daily Up
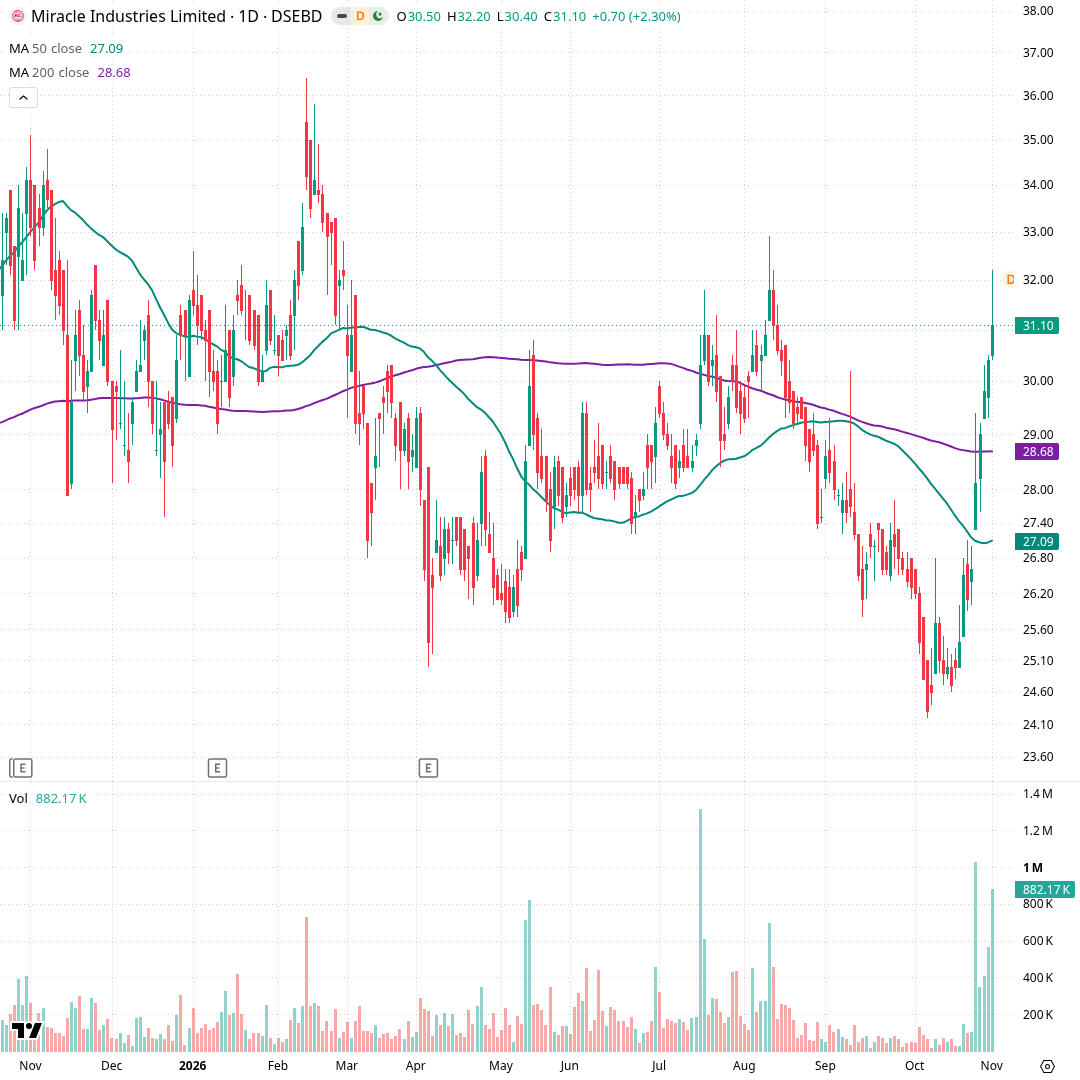
About one year of daily candles; one candle is one trading day. Green is the 50-day average (৳27.09), purple the 200-day (৳28.68); volume is below. Price peaked at ৳36.40 in February, fell to ৳25.00 in April, ranged ৳27–৳33 through August, then slid to ৳24.20 in early October. From 25 October it rose six days in a row: ৳28.10 on 1.03 million shares, then ৳29.00, ৳29.80, ৳30.40 and ৳31.10 today on 882,175 shares. Price is now above both averages; the 50-day is still below the 200-day.
Hourly Up
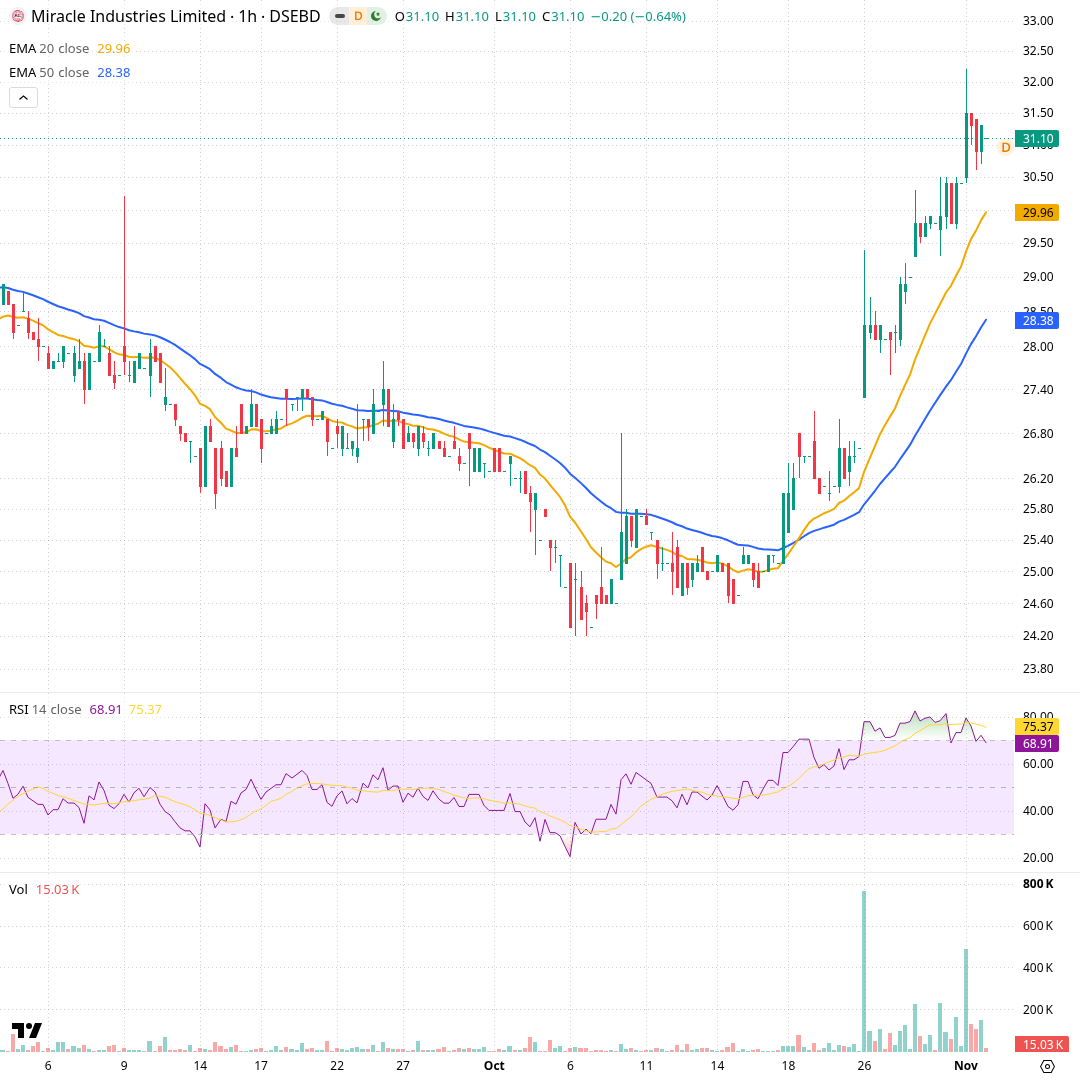
About two months of hourly candles; one candle is one trading hour. Orange is the 20-hour exponential average (৳29.96), blue the 50-hour (৳28.38); RSI and volume are below. Price drifted down through September to a ৳24.20 low in early October, with both averages falling. From about 19 October it turned up, and on 25 October jumped from ৳26.40 toward ৳29.40 on one of the largest hourly volume bars. Today it touched ৳32.20 before settling at ৳31.10. Hourly RSI eased from above 75 to 68.9.
Momentum and volume
Buying interest has been strong. RSI, a 0–100 momentum gauge, is at 76, a level usually called overbought, meaning price has risen fast in a short time. MACD is rising, and the ADX trend-strength reading is climbing. Volume is about four times its average, so the move has had real participation.
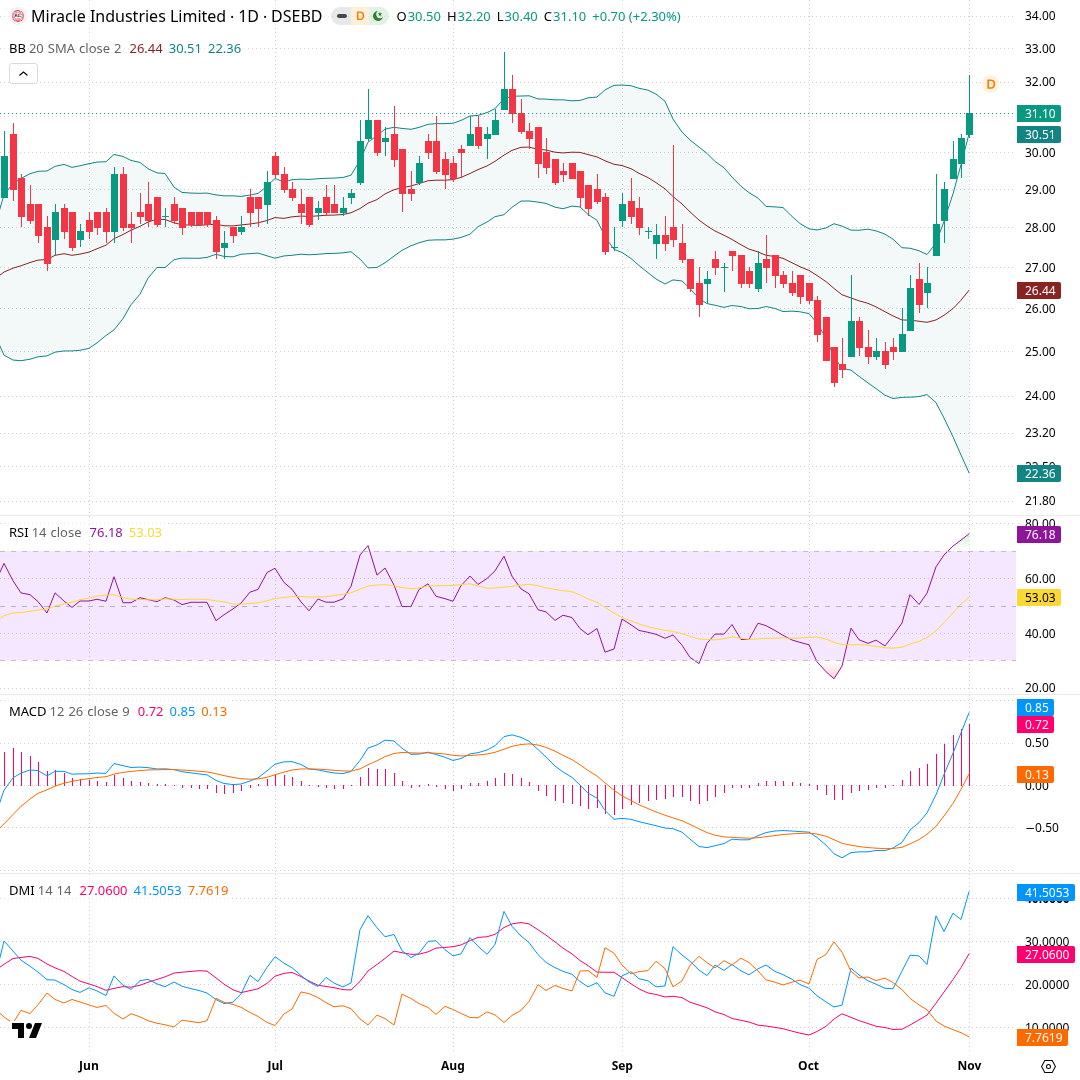
About six months of daily candles; one candle is one day. Bollinger Bands show a 20-day average (৳26.44) with bands two standard deviations away (৳22.36–৳30.51); below are RSI, MACD and ADX/DMI, which measures trend strength and direction. Price slid along the lower band from August to an early-October low of ৳24.20, when RSI touched about 23. Since then it has climbed through the middle band and closed above the upper band at ৳31.10. RSI is 76.2, MACD (0.85) is well above its signal (0.13), and ADX has risen to 27.1 with +DI 41.5 versus -DI 7.8.
What would change the picture
Each scenario card names a price condition and what it would mean for the chart's structure if it happened. They are not predictions. They are checkpoints to watch: for example, whether price can close above the August high, or whether it falls back below the breakout day.
Recent changes and what followed
Each row is a day a tracked signal changed, and the price move over the next 5, 20 and 60 trading days (blank until that many days have passed). Past moves do not predict future ones.
| Date | Change | Close | Next 5 days | Next 20 days | Next 60 days |
|---|---|---|---|---|---|
| 2026-11-01 | Volume three times or more its 20-day average | ৳31.10 | |||
| 2026-10-29 | Volume three times or more its 20-day average | ৳30.40 |
- Computed from daily closing prices (method t1, wording agent-2); history kept from 2026-10-29.
- Describes price history only. Not investment advice, not a rating or a price target.