Mercantile Bank PLC. (MERCANBANK) technical report
As of the 2026-11-01 close. Updated every trading day. Company page · All DSE stocks: technical data
In plain words
Mercantile Bank's share price has been falling for a long time. It was near ৳20 in late 2021 and has made lower highs and lower lows since. This year it traded between ৳7.30 and ৳9.40 until late April, then dropped sharply on 3 May, opening at ৳8.20 and closing at ৳7.20. A summer bounce reached ৳7.80 in July, but the price slid again to ৳6.00 in October, its lowest level in the past year. Over the last two weeks it has crept back up to ৳6.50. It now sits right at the 50-day average (the average closing price of the last 50 trading days), ৳6.55, and well below the 200-day average (the average of the last 200 trading days), ৳7.53. The levels that matter now are ৳6.55–৳6.60 just above, ৳7.53 further up, and ৳6.20 and ৳6.00 below.
Key levels
Support is a price where buyers have stepped in before; resistance is where selling has stopped rises. For Mercantile Bank, ৳6.00–৳6.10 is support: the May spike and the October low both stopped there. Above, ৳6.55–৳6.60 (today's high and the 50-day average) is the first ceiling, then ৳7.50, where the 200-day average sits, and the July high of ৳7.80.
Trend on each timeframe
The monthly and weekly charts both point down: price is under the 12-month average (৳7.46) and the 40-week average (৳7.52). The daily chart is still below its 200-day average. The hourly chart disagrees: since mid-October it shows higher lows, with price above both short averages. So the short-term rebound is happening inside a longer decline.
Monthly Down
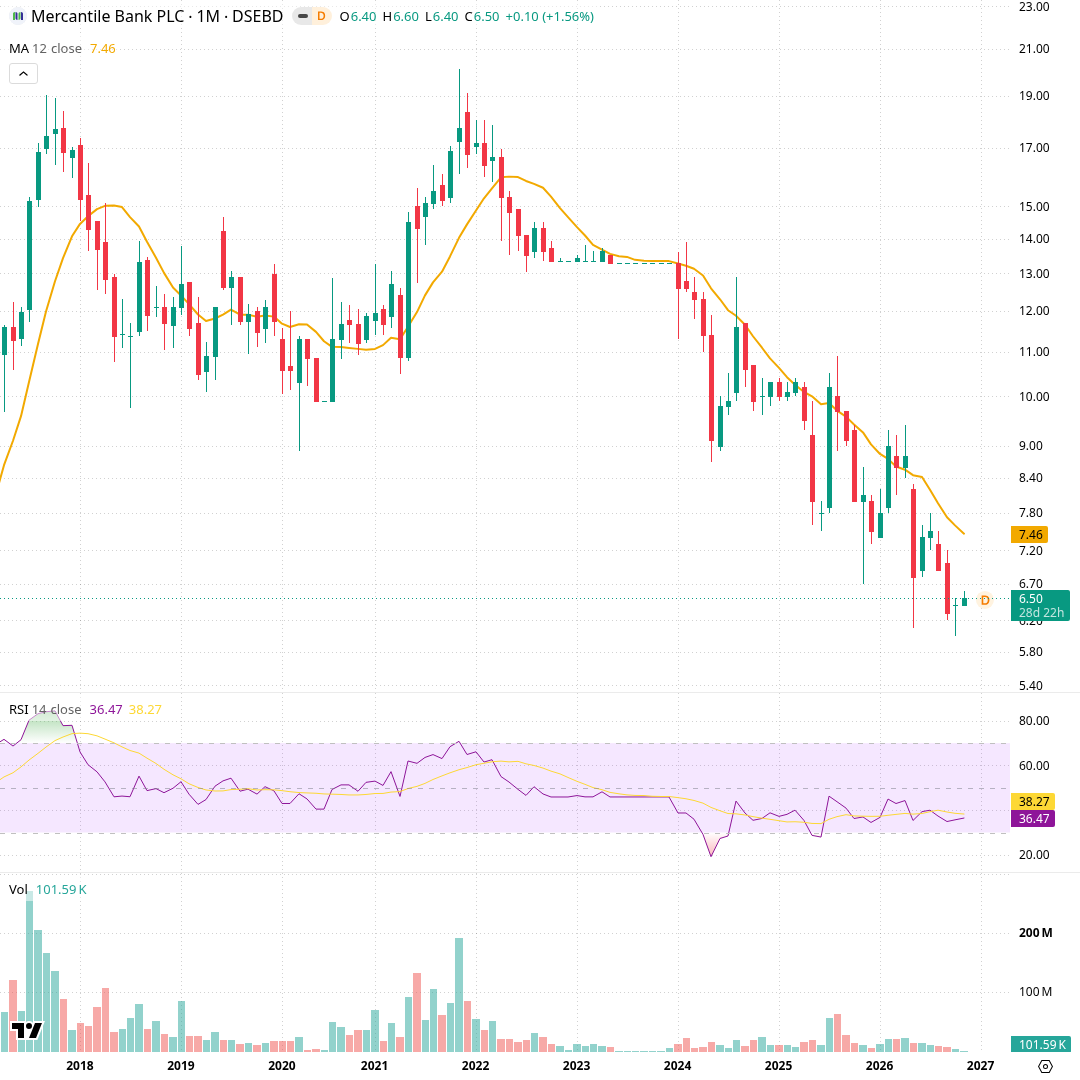
This chart covers about ten years; one candle is one month. The orange line is the 12-month simple average (৳7.46), the panel below is RSI (14), a 0–100 momentum gauge, and the bottom panel is volume. After peaking near ৳20 in late 2021, price has made lower highs and lower lows for four years, and the 12-month average has sloped down throughout. The May 2026 candle dropped to ৳6.10, and October set a new low at ৳6.00. Price ৳6.50 is below the average; RSI at 36.5 is weak but not extreme.
Weekly Down
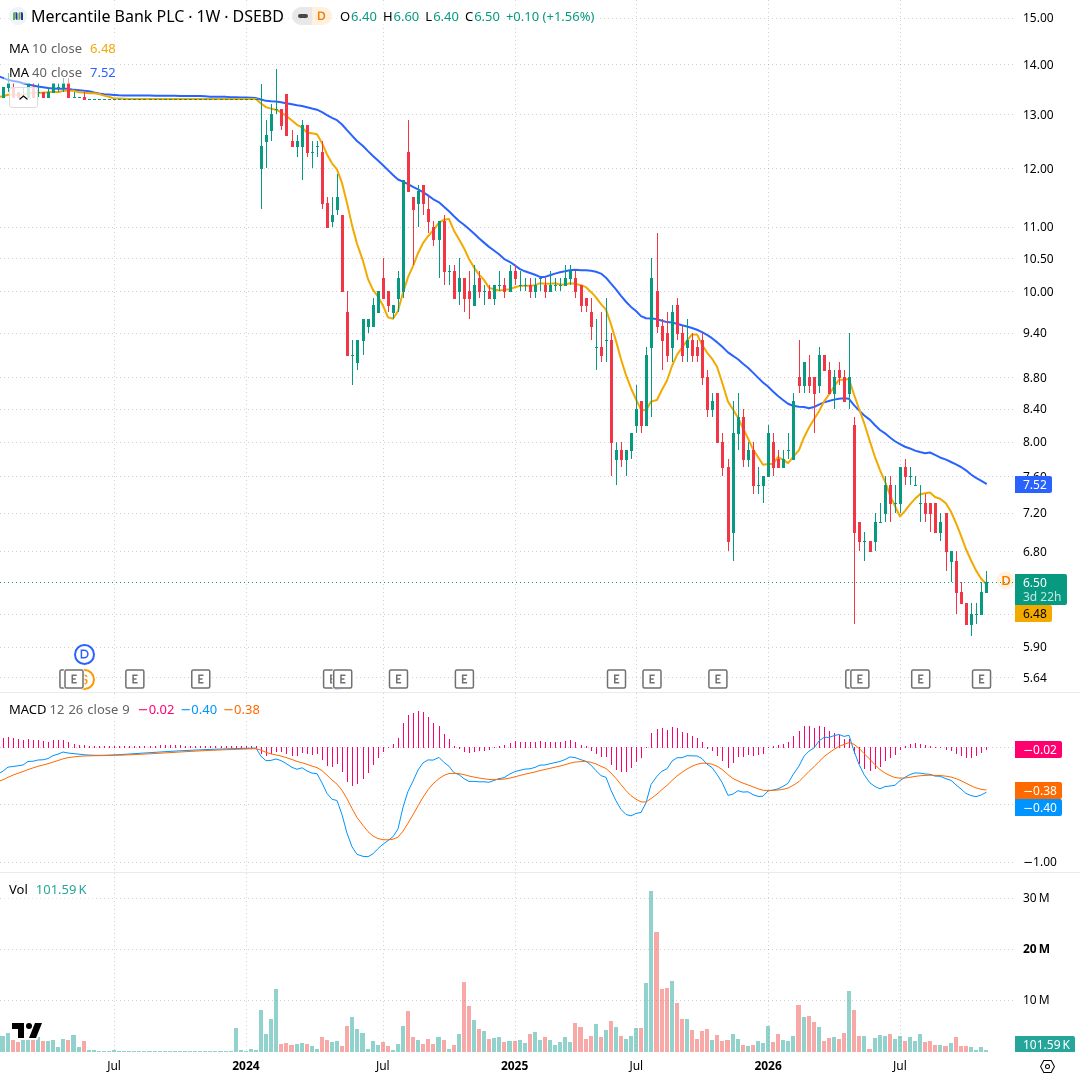
About four years of weekly candles; one candle is one week. Orange is the 10-week average (৳6.48), blue the 40-week average (৳7.52); MACD below shows trend momentum, and volume is at the bottom. The 40-week line has fallen steadily since 2024. The week of 3 May 2026 dropped from ৳8.20 to a ৳6.10 low; a rebound reached ৳7.80 in July, then a new slide took price to ৳6.00 in October. The last two weeks closed at ৳6.40 and ৳6.50, back at the 10-week line. MACD (-0.40) is just under its signal (-0.38).
Daily Down
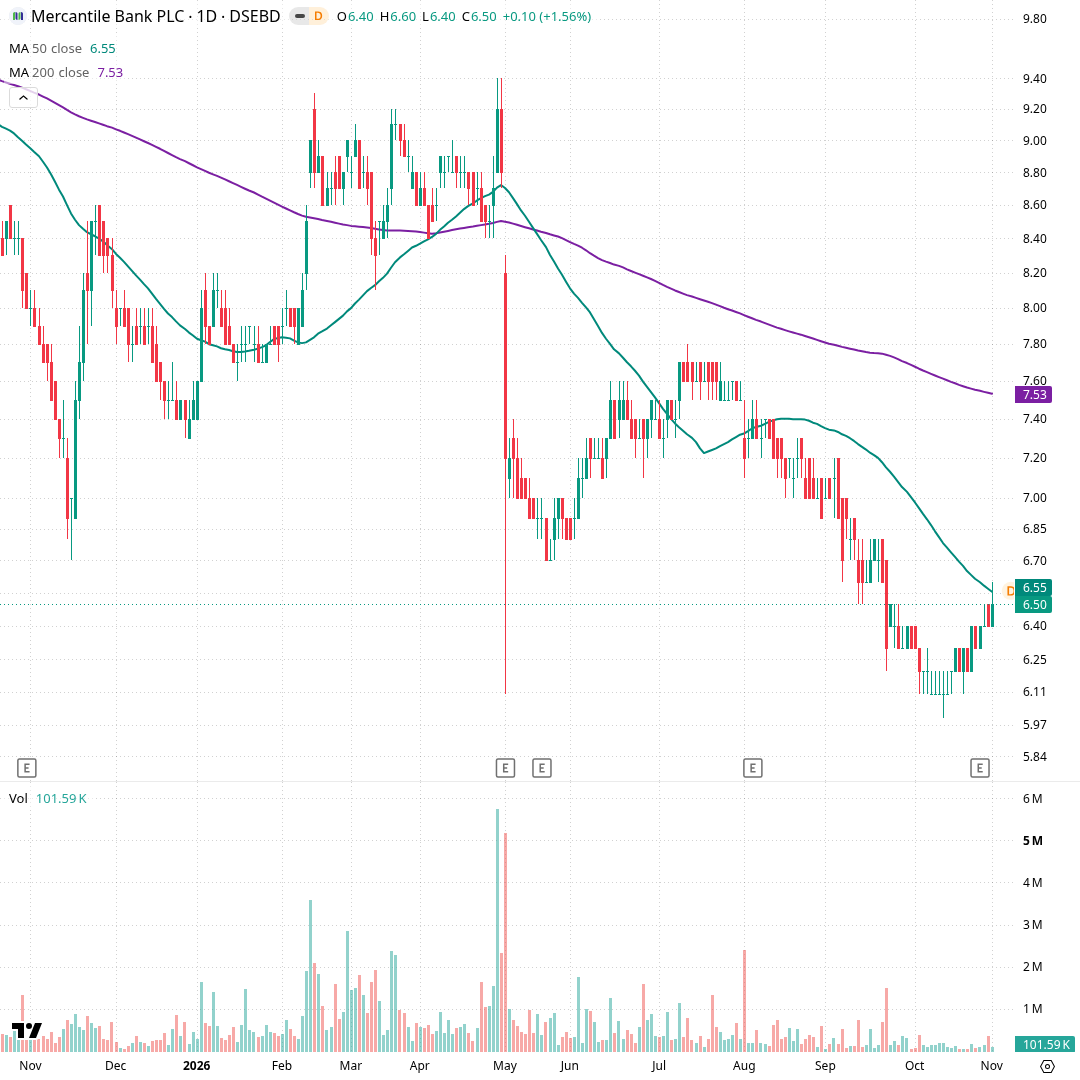
About one year of daily candles; one candle is one trading day. Green is the 50-day average (৳6.55), purple the 200-day (৳7.53); volume is below. Price traded ৳7.30–৳9.40 from February to April, then gapped down on 3 May (open ৳8.20, low ৳6.10, close ৳7.20) on 5.17 million shares. A July rebound peaked at ৳7.80, then price drifted down to a ৳6.00 low in October. Since mid-October it has climbed to ৳6.50, right under the 50-day line, on daily volumes mostly below 400,000 shares.
Hourly Up
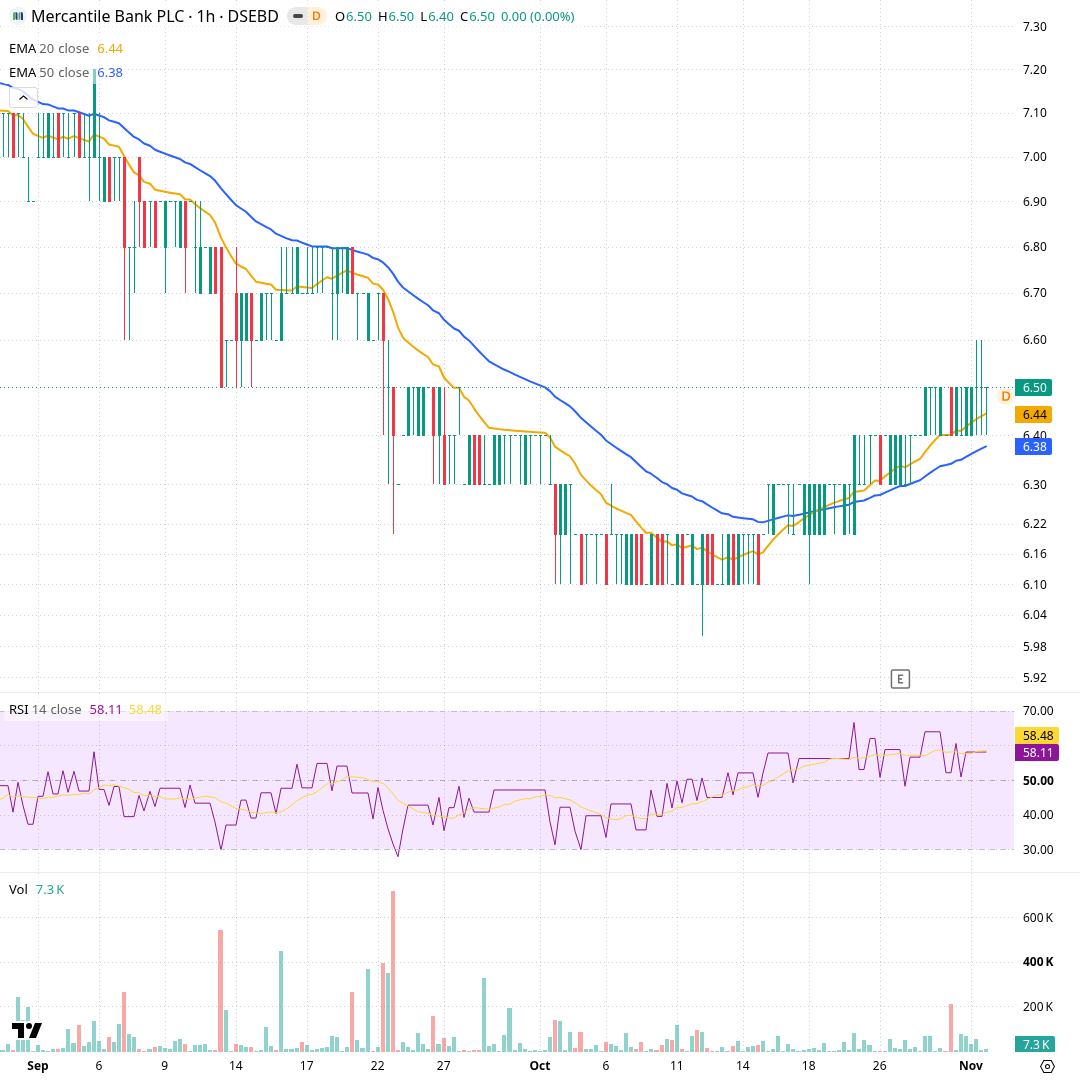
About two months of hourly candles; one candle is one trading hour. Orange is the 20-hour exponential average (৳6.44), blue the 50-hour (৳6.38); RSI and volume are below. Through September and early October price stepped down from ৳7.10 to a ৳6.00 spike low, with both averages falling. From about 16 October it rose in small steps to ৳6.30, ৳6.40 and ৳6.50, touching ৳6.60 today. Both averages have turned up with the 20 above the 50. Hourly RSI is 58.1.
Momentum and volume
Selling pressure has eased. RSI, a 0–100 momentum gauge, rose from about 30 to 56, and MACD has crossed above its signal line. The ADX trend-strength reading is falling from a very high level, which often means a strong trend is losing force. But turnover is about 25% below average, so the rebound has come without heavy buying.
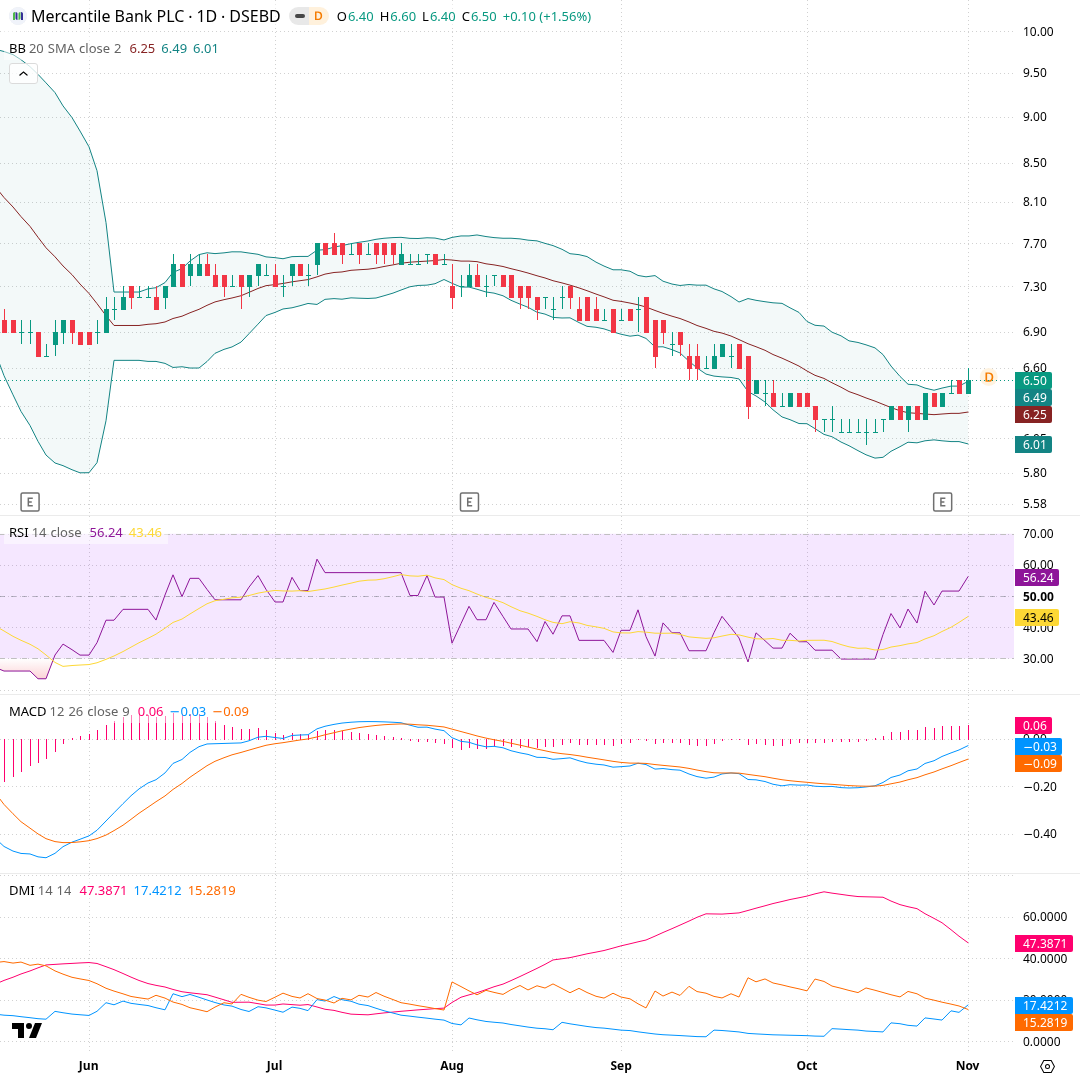
About six months of daily candles; one candle is one day. Bollinger Bands are a 20-day average (৳6.25) with bands two standard deviations away (৳6.01–৳6.49); below are RSI, MACD and ADX/DMI, which measures trend strength and direction. Price rode the lower band down from August to mid-October, when RSI sat near 30. Since then RSI rose to 56.2, MACD (-0.03) crossed above its signal (-0.09), and price closed at ৳6.50 on the upper band. ADX has fallen from about 70 to 47.4, and +DI (17.4) has just crossed above -DI (15.3).
What would change the picture
Each scenario card names a price condition and what it would mean for the chart's structure if it happened. They are not predictions. They are checkpoints to watch: for example, whether price can close above the 50-day average, or whether it falls back below the October base.
Recent changes and what followed
Each row is a day a tracked signal changed, and the price move over the next 5, 20 and 60 trading days (blank until that many days have passed). Past moves do not predict future ones.
| Date | Change | Close | Next 5 days | Next 20 days | Next 60 days |
|---|---|---|---|---|---|
| 2026-11-01 | Trend label changed from Downtrend to Sideways | ৳6.50 |
- Computed from daily closing prices (method t1, wording agent-2); history kept from 2026-11-01.
- Describes price history only. Not investment advice, not a rating or a price target.