Meghna Condensed Milk Industries Limited (MEGCONMILK) technical report
As of the 2026-11-01 close. Updated every trading day. Company page · All DSE stocks: technical data
In plain words
Meghna Condensed Milk had a dramatic 2026. From a low of ৳11.5 in November 2025 the price more than quadrupled to ৳51.0 by early June, with very heavy trading. Since June it has been sliding: each rally has peaked lower than the one before (about ৳42.6, ৳41.2, then ৳40.5), and trading volume has dried up. Through October the price held a floor around ৳28.0, but today it closed at ৳27.70, just under that floor, after an unusual opening trade at ৳20.50. It now sits below both its 50-day average (the average closing price of the last 50 trading days, ৳32.01) and its 200-day average (the same over 200 days, ৳31.90). The levels that matter now are ৳28.0–28.3 just overhead, the ৳32 area where both averages meet, and the ৳24.0–24.4 zone from February below.
Key levels
Support is a price where buying has stopped declines before; resistance is where selling has capped rallies. On this stock, ৳28.0–28.3 acted as support all October and has just been broken, so it may now act as a ceiling. The ৳34.4–36.1 band capped bounces in August and September, while ৳24.0–24.4 is where price paused in February.
Trend on each timeframe
The monthly chart still shows a big 2026 advance, now largely retraced and back below its one-year average. The weekly and daily charts both point down, with short averages below long ones and lower highs since June. The hourly chart agrees, staying under its short averages. The only disagreement is scale: the long-term picture is a giveback, the shorter ones a clear decline.
Monthly Sideways
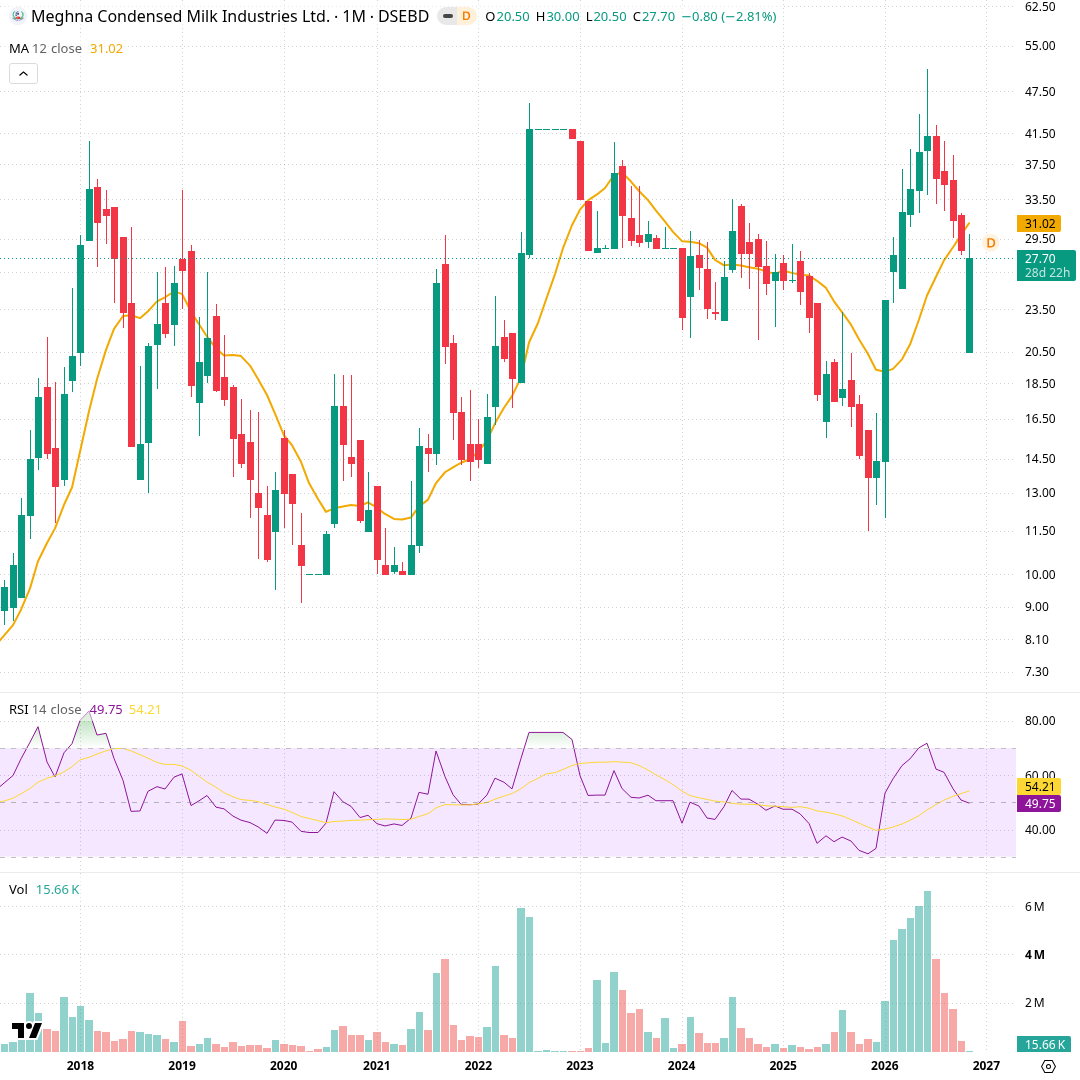
Each candle is one month, covering roughly ten years. The orange line is the 12-month simple average (about one year of closes), now ৳31.02. The lower panel shows RSI(14), a 0–100 momentum gauge, at 49.75. Price ran from a November 2025 low of ৳11.5 to ৳51.0 in June 2026 on the heaviest monthly volume in the chart. Since then monthly candles have been mostly red, and price at ৳27.70 has slipped back below the 12-month line.
Weekly Down
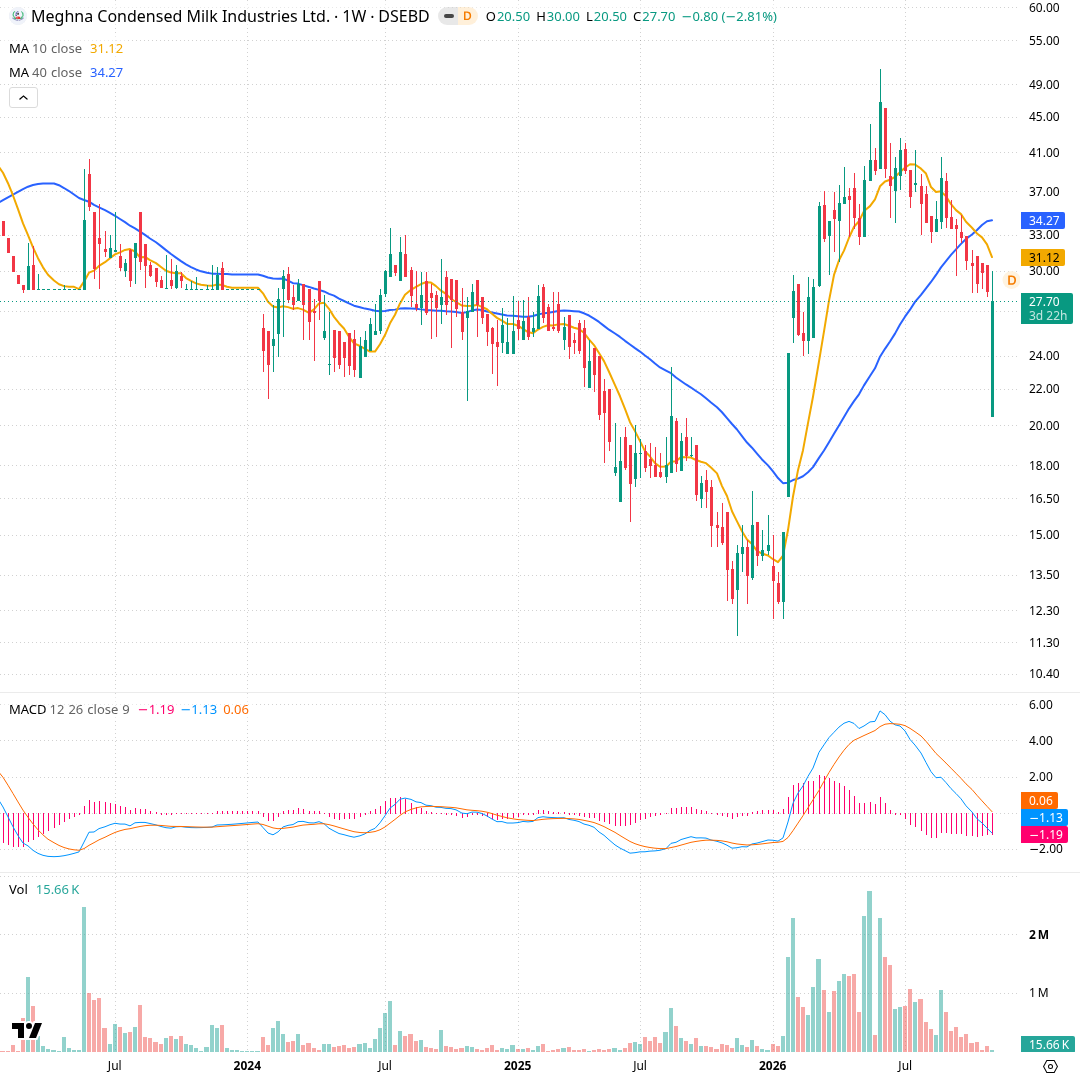
Each candle is one week, over about four years. The orange line averages the last 10 weekly closes (৳31.12), the blue line the last 40 (৳34.27). The MACD panel compares two exponential averages; its line at −1.13 sits below the signal. After the 2026 surge to ৳51.0, weekly highs stepped down to ৳42.6, ৳41.2 and ৳40.5, and the short average has crossed below the long one. Weekly volume has shrunk from above 2 million shares in May to 78,417 last week.
Daily Down
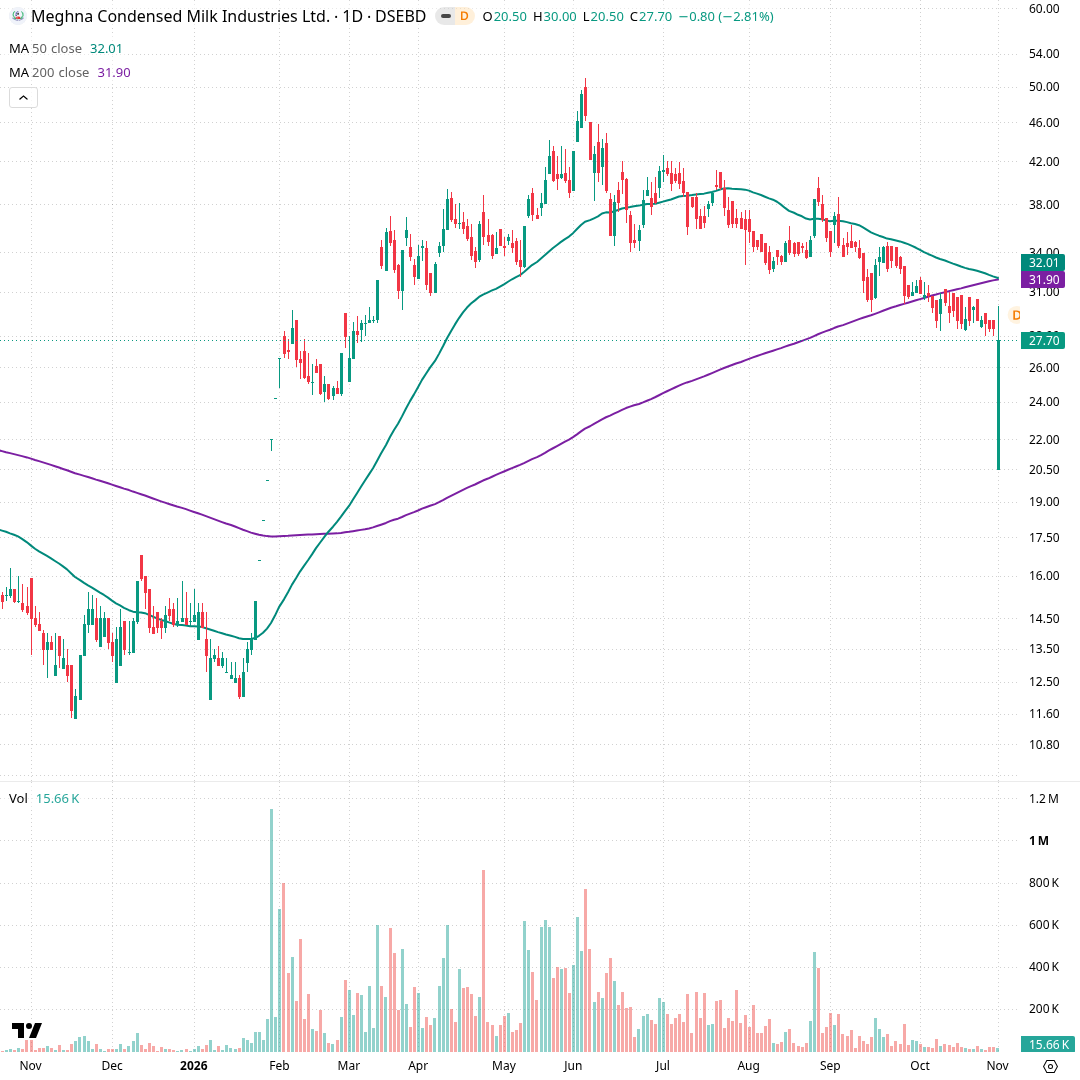
Each candle is one trading day, covering about a year. The green line is the 50-day average (৳32.01) and the purple line the 200-day average (৳31.90). Price broke above both in February 2026 and peaked at ৳51.0 on 4 June. Since then daily closes have drifted lower, crossing below the 200-day line in October. Today's bar opened at ৳20.50, traded up to ৳30.00 and closed at ৳27.70 on 15,656 shares, about 0.73 times the average volume.
Hourly Down
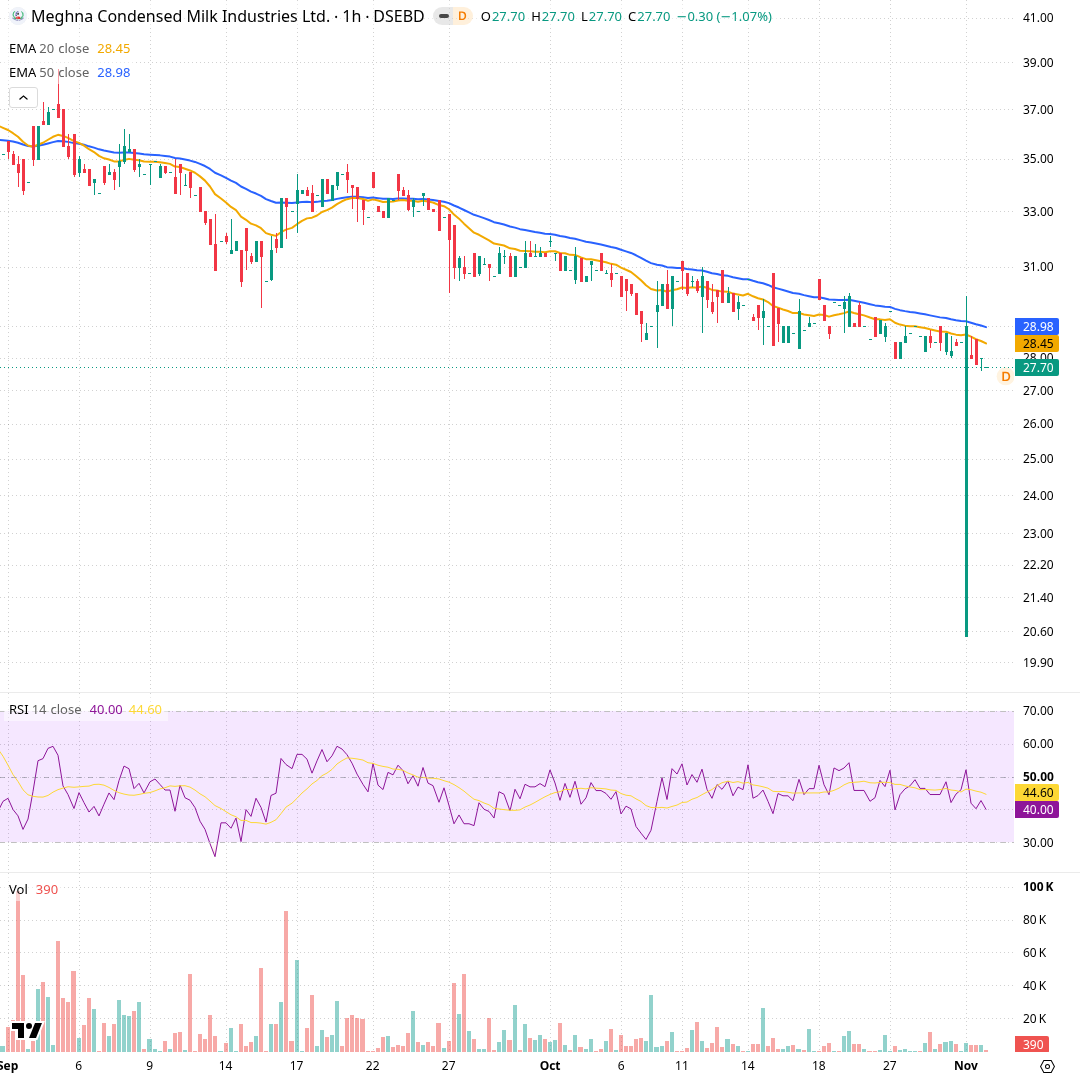
Each candle is one trading hour, covering roughly two months. The orange line is the 20-hour exponential average (৳28.45) and the blue line the 50-hour one (৳28.98); price has stayed mostly under both since early September, sliding from about ৳37 to ৳27.70. RSI(14) sits at 40. Today's first hour printed a long spike down to about ৳20.60 before recovering, then price settled below the October floor near ৳28.0.
Momentum and volume
Momentum is weak. RSI at 33 is close to the zone traders call oversold, meaning prices have fallen steadily. ADX near 30 says the move has direction, and that direction is down, with selling pressure far outweighing buying. Volume is below average, so the decline is happening without heavy trading.
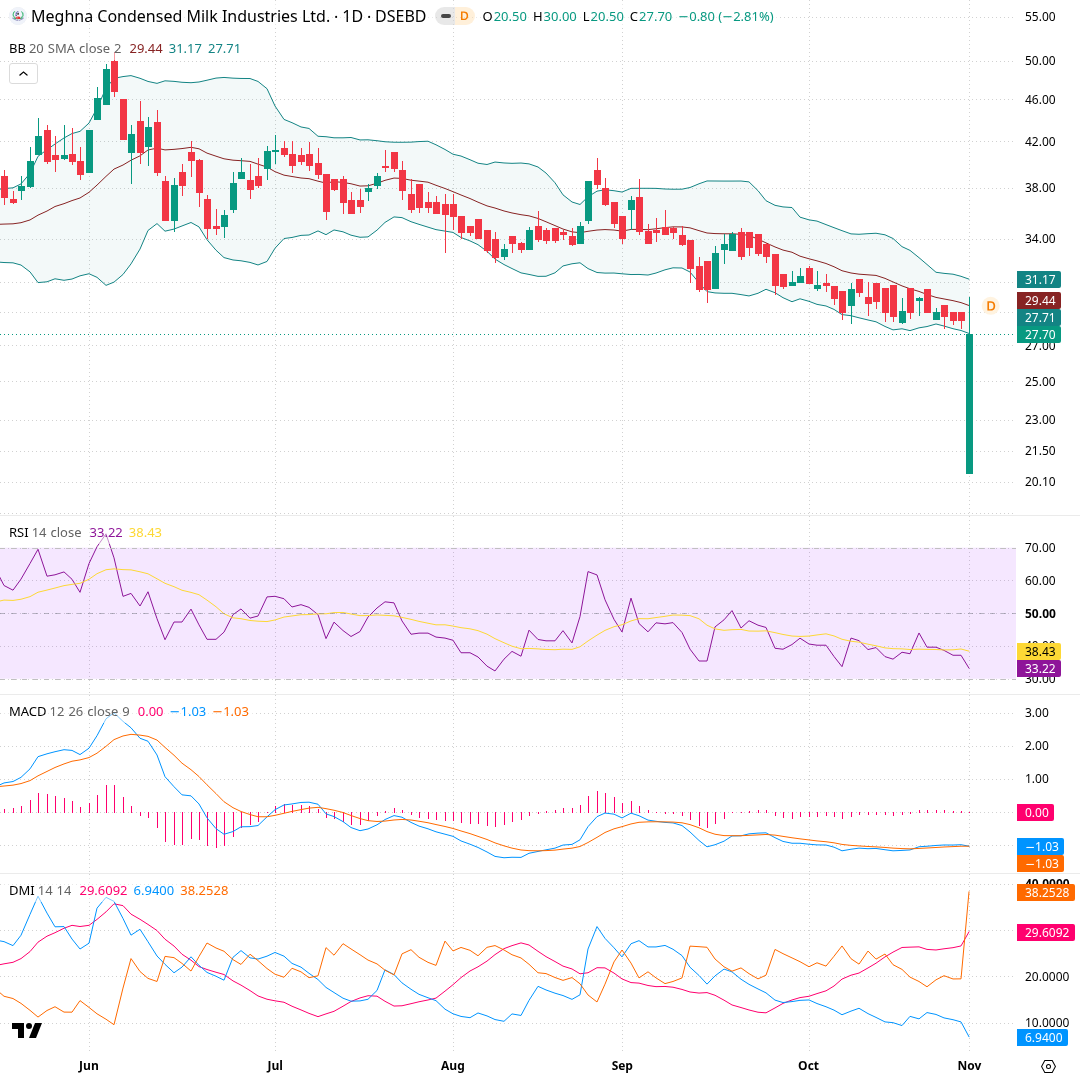
Each candle is one trading day, covering about six months. The shaded Bollinger band marks two standard deviations around the 20-day average (middle ৳29.44, upper ৳31.17, lower ৳27.71); price has ridden the lower half since July and closed on the lower edge. RSI(14) is 33.22, near oversold. MACD and its signal are both −1.03, flat below zero. The DMI panel shows ADX at 29.6 with −DI jumping to 38.3 against +DI 6.9, reflecting today's deep intraday dip.
What would change the picture
The scenario cards list price conditions worth watching and what each would mean for the chart's structure. They are not predictions: none of them is expected to happen, they simply describe how the picture would change if price closed beyond each level.
Recent changes and what followed
Each row is a day a tracked signal changed, and the price move over the next 5, 20 and 60 trading days (blank until that many days have passed). Past moves do not predict future ones.
| Date | Change | Close | Next 5 days | Next 20 days | Next 60 days |
|---|---|---|---|---|---|
| 2026-11-01 | MACD crossed below its signal line | ৳27.70 |
- Computed from daily closing prices (method t1, wording agent-2); history kept from 2026-11-01.
- Describes price history only. Not investment advice, not a rating or a price target.