Matin Spinning Mills PLC (MATINSPINN) technical report
As of the 2026-11-01 close. Updated every trading day. Company page · All DSE stocks: technical data
In plain words
Matin Spinning's share price spent most of late 2025 and early 2026 stuck between about ৳44 and ৳51. In June it began to climb and has kept climbing, reaching ৳63 in July, ৳68.7 in August and ৳75 in October. After a short pause near ৳80–84 last week, today it jumped 9.8% to close at ৳91.60, its highest price in more than a year and above its 2022 peak near ৳84. The move came on 1.98 million shares, the busiest day of the year. Price is now far above the 50-day average (the average closing price of the last 50 trading days, ৳68.82) and the 200-day average (৳54.98). The levels that matter are today's ৳91.7 high, the late-October zone around ৳83–84.5 and last week's lows near ৳79. The stock has more than doubled from its ৳43.8 low of November 2025.
Key levels
Support is where falls have stopped before; resistance is where rises have stalled. Matin Spinning has few overhead levels because it is at a new high. Below, the ৳83–84.5 zone capped price in late October and was cleared today; ৳79–80 held as the floor of last week's pause, and ৳69.5–70.5 marked the mid-October dip.
Trend on each timeframe
All four pictures agree. The monthly chart shows the highest close in ten years, the weekly shows a steep rise with both averages climbing, the daily shows a staircase of higher highs since June, and the hourly broke out today. The main disagreement is with momentum gauges, which read stretched on every timeframe.
Monthly Up
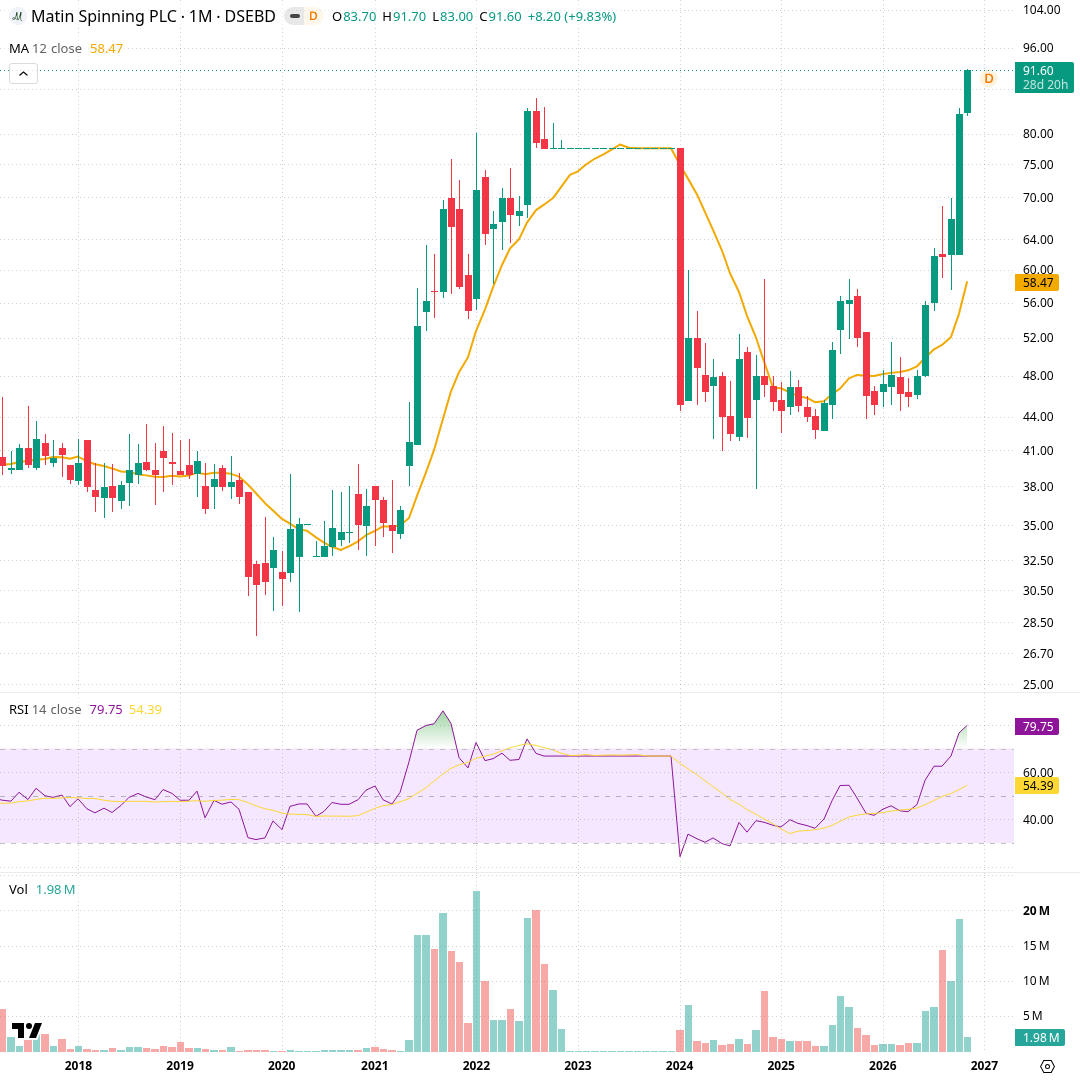
Each candle is one month, about ten years shown. The orange line is the 12-month average; RSI (14) and volume are below. Price ran from about ৳28 in 2020 to a 2022 peak near ৳84, collapsed in early 2024 to the mid-৳40s, and based there through mid-2026. Since June it has climbed every month, and the current candle at ৳91.60 is the highest close on the chart, far above the 12-month average of ৳58.47. Monthly RSI is 79.8, an overbought reading.
Weekly Up
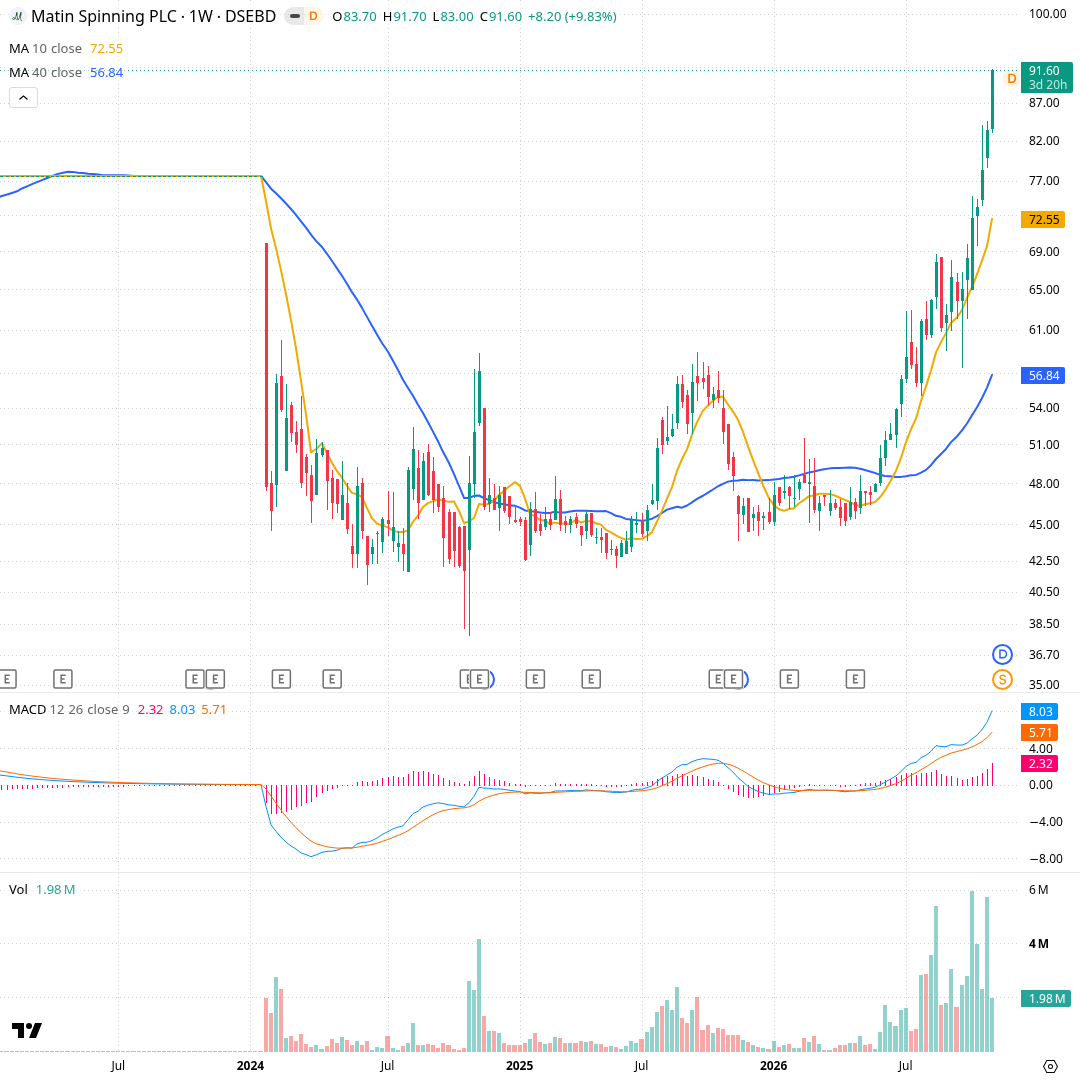
Each candle is one week, around four years in view. Orange is the 10-week average, blue the 40-week; MACD and volume are below. After a long 2024–2026 base mostly between ৳42.5 and ৳51, price broke higher in June 2026 and has risen almost without pause. The 10-week (৳72.55) is well above the 40-week (৳56.84), both rising. MACD is 8.03 against a 5.71 signal, the strongest reading on this chart. Weekly volume has run at several million shares, far above the base period.
Daily Up
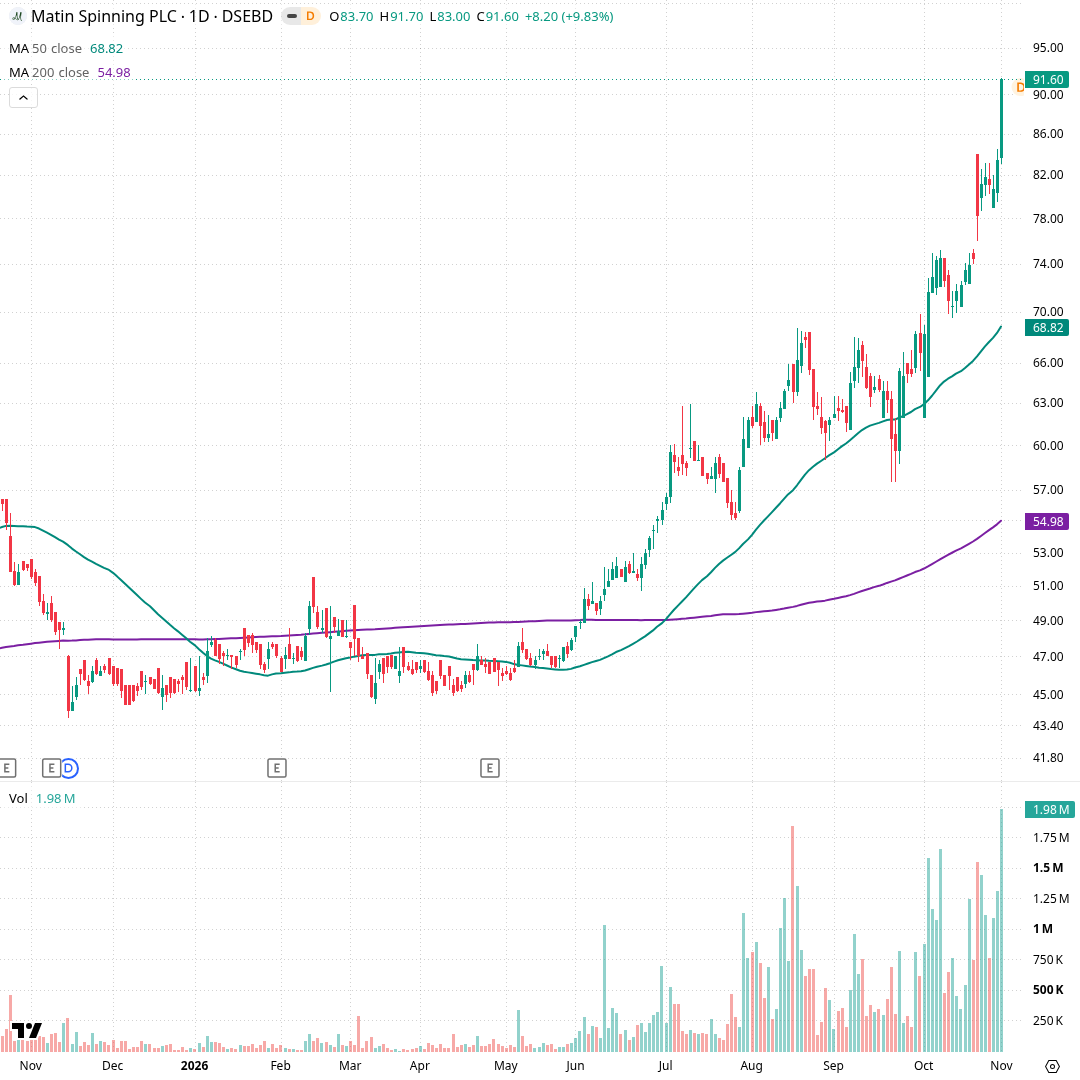
Each candle is one trading day over about a year. Green is the 50-day average, purple the 200-day, with volume below. Price sat in a ৳43.8–51.5 range from November 2025 to May 2026, then climbed in steps: ৳63 in July, ৳68.7 in August, ৳75.3 in October and ৳84.5 late October. Today it closed at ৳91.60 (high ৳91.7) on 1.98M shares, the biggest volume of the year. The 50-day (৳68.82) crossed above the 200-day (৳54.98) in June.
Hourly Up
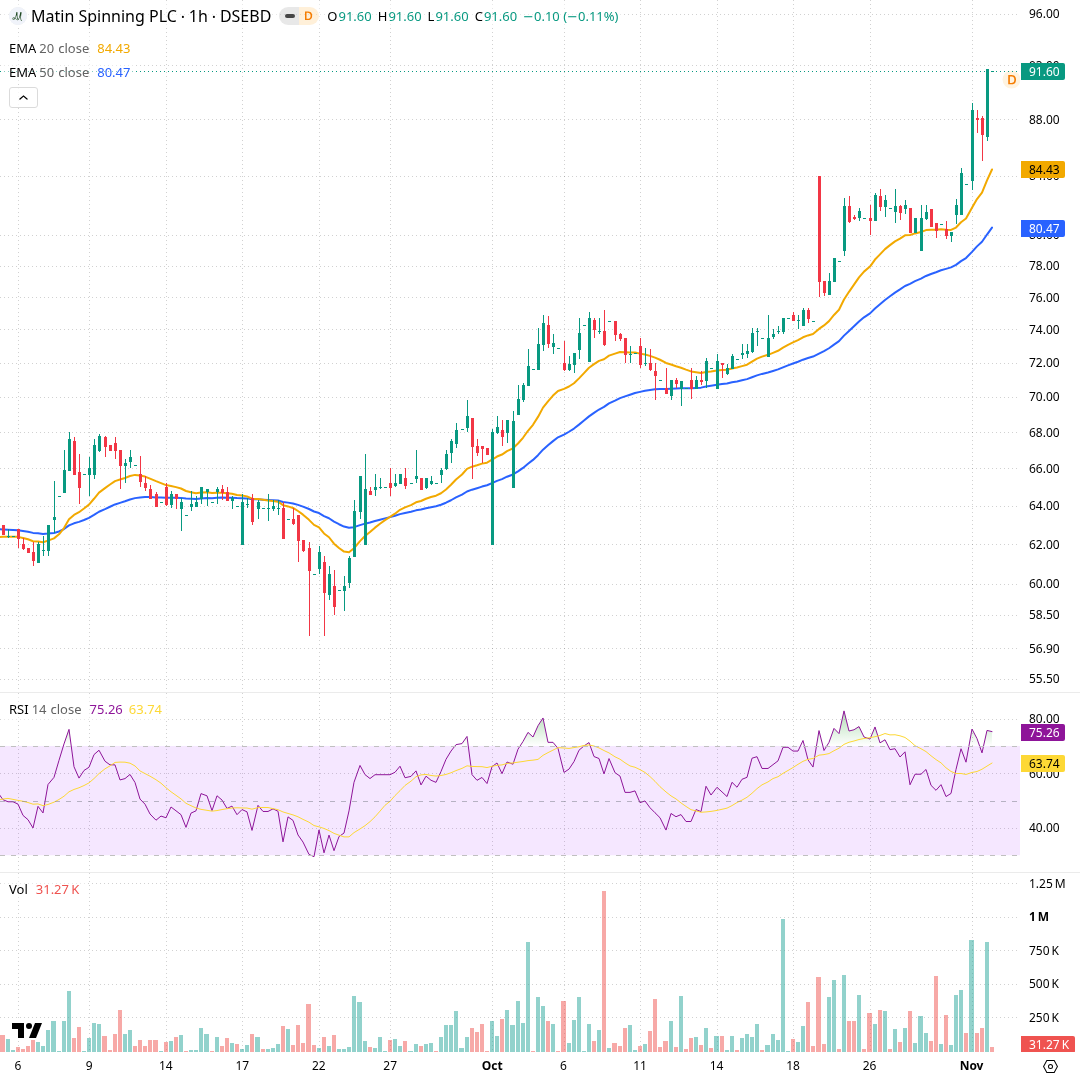
Each candle is one trading hour, about two months shown. Orange is the 20-hour exponential average, blue the 50-hour; RSI and volume below. Price climbed from a ৳57.5 dip in late September through ৳75 in early October, held ৳79–84.5 for a week, and broke out today to ৳91.60. Both averages are rising, with price well above them (৳84.43 and ৳80.47). Hourly RSI is 75.3; the latest hours carried some of the heaviest volume on the chart.
Momentum and volume
Buying pressure is strong and rising: MACD is widening, trend strength (ADX 33) is high, and volume is about double its average. At the same time, RSI at 84 and a close above the upper Bollinger band mean the price has moved unusually far, unusually fast compared with its recent history.
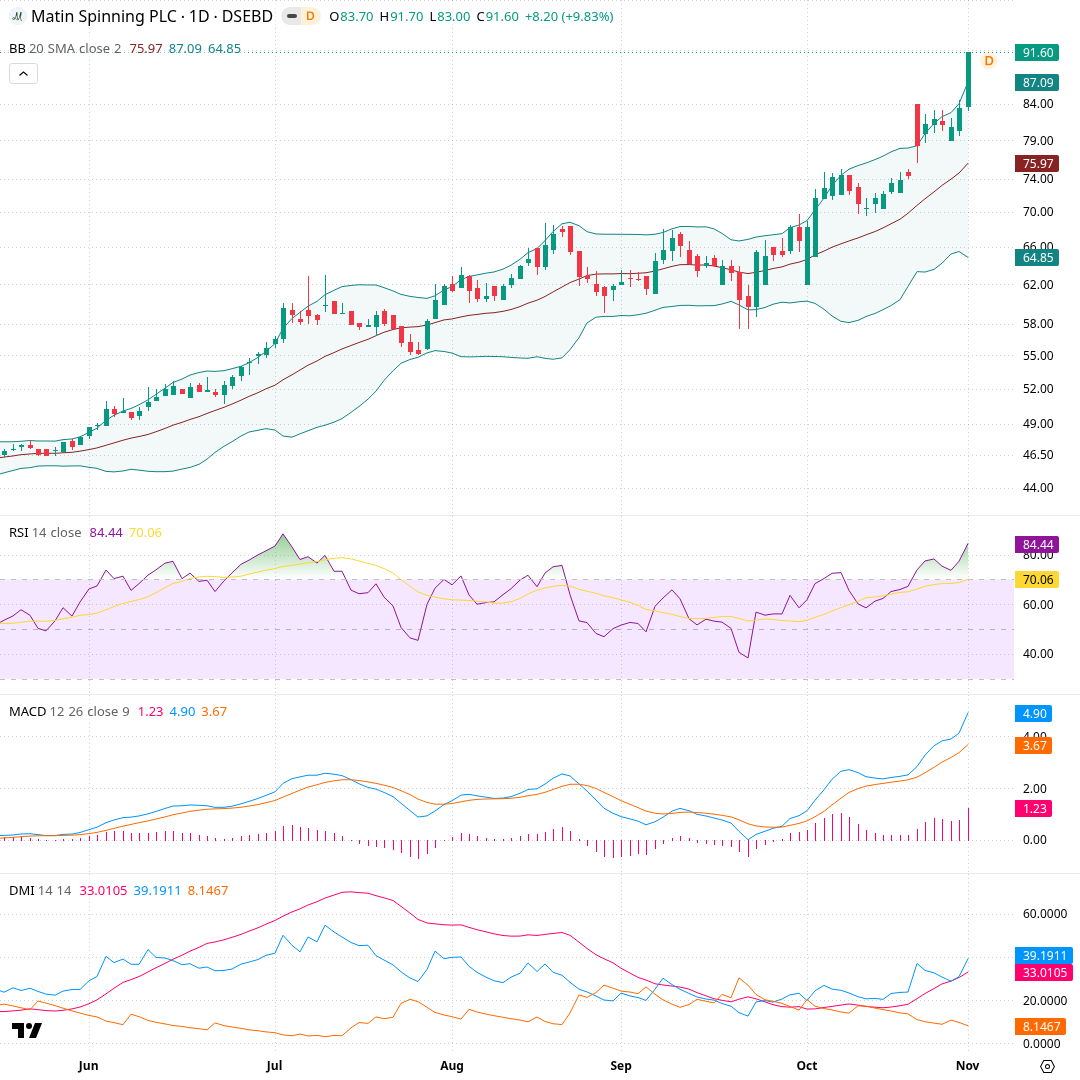
Each candle is one trading day over about six months. Bollinger Bands (20-day average ± two standard deviations) surround price; RSI, MACD and ADX/DMI are below. Price has ridden the upper half of the bands since June, and today closed at ৳91.60, above the upper band at ৳87.09. RSI is 84.4, its highest in the window. MACD is 4.90 over a 3.67 signal and rising. ADX is 33.0 with +DI 39.2 far above -DI 8.1, showing a strong, one-sided uptrend.
What would change the picture
Each scenario card describes a price condition and what it would mean for the chart's shape. They are things to watch for, not predictions; none says which outcome is more likely.
Recent changes and what followed
Each row is a day a tracked signal changed, and the price move over the next 5, 20 and 60 trading days (blank until that many days have passed). Past moves do not predict future ones.
| Date | Change | Close | Next 5 days | Next 20 days | Next 60 days |
|---|---|---|---|---|---|
| 2026-10-29 | New 52-week closing high | ৳83.40 |
- Computed from daily closing prices (method t1, wording agent-2); history kept from 2026-10-29.
- Describes price history only. Not investment advice, not a rating or a price target.