Malek Spinning Mills PLC. (MALEKSPIN) technical report
As of the 2026-11-01 close. Updated every trading day. Company page · All DSE stocks: technical data
In plain words
Malek Spinning's share price spent most of 2025 and early 2026 between roughly ৳25 and ৳32. In late June and July 2026 it climbed sharply, from about ৳30 to the mid-৳40s, on very heavy trading. From August to early October it moved sideways between about ৳44 and ৳52, setting its highest price of the past year, ৳54.20, on 3 September. Since early October the price has slipped. It now trades at ৳43.90, below its 50-day average (the average closing price of the last 50 trading days) of ৳47.15, but still well above its 200-day average (the average of the last 200 days) of ৳35.96. On 27 October it briefly fell to ৳40.00 before recovering the same day. The levels that matter most now are ৳40.00 below and the ৳47 area above, with the ৳50-54 zone marking the summer highs.
Key levels
Support is a price where buying has stopped falls before; resistance is where selling has capped rises. On Malek Spinning, ৳50-51.60 capped rallies several times from August to October, and ৳54.20 is the peak. Below, ৳40.00 is where a sharp drop on 27 October was bought back within the day.
Trend on each timeframe
The monthly and weekly charts still show a stock that broke out of a multi-year range this summer and remains far above its long averages. The daily and hourly charts show the pullback: price is below the 50-day line and the hourly chart has made lower highs since early October. Longer views are up, shorter views are down.
Monthly Up
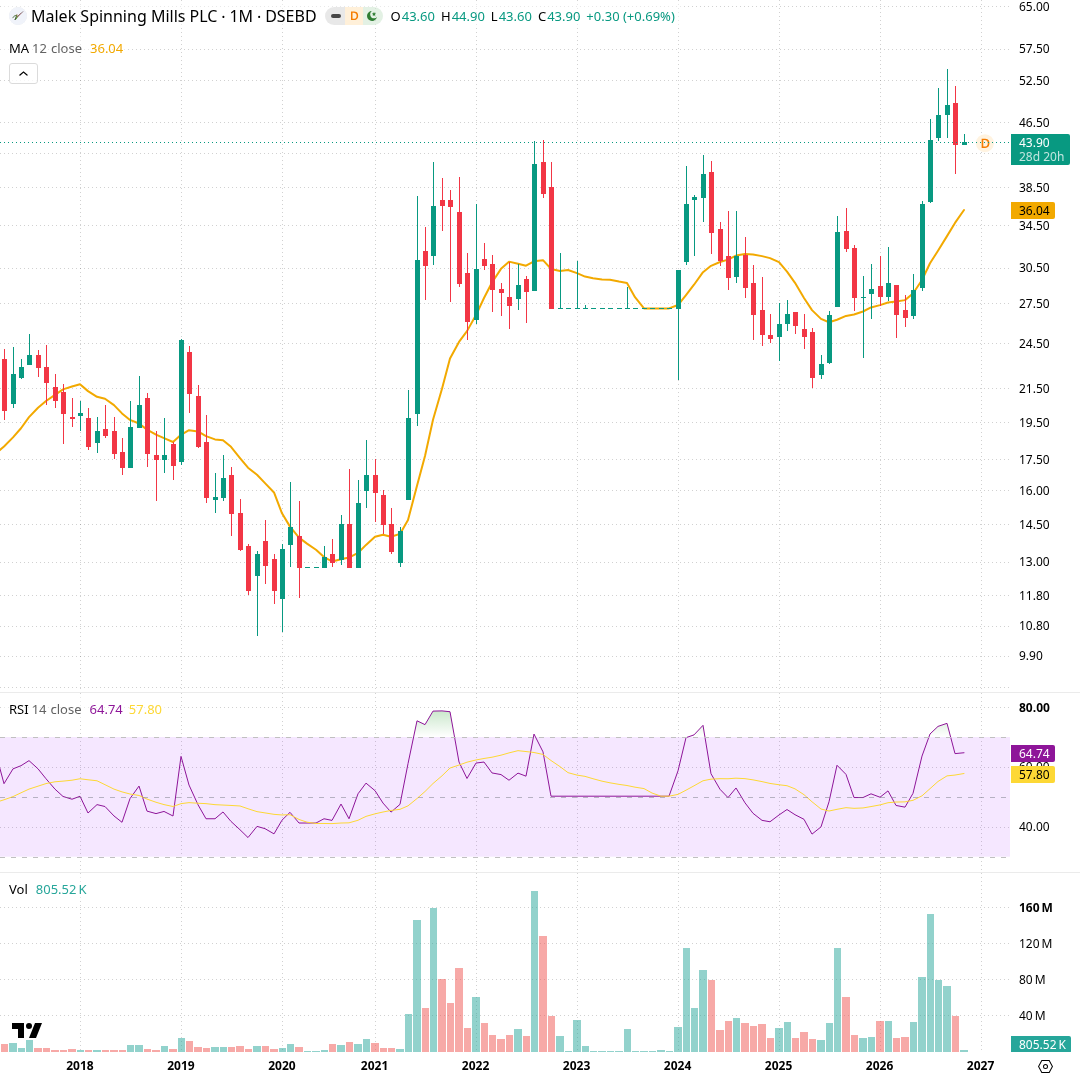
Each candle is one month, covering about ten years. The orange line is the 12-month simple average (৳36.04); the lower panels show RSI 14 (64.74) and monthly volume. Price spent 2022-2025 inside a ৳22-44 band, then rallied from mid-2026 on the heaviest volume since 2022, setting a high of ৳54.20 in September. October closed lower and November so far trades at ৳43.90, still well above the rising 12-month average.
Weekly Sideways
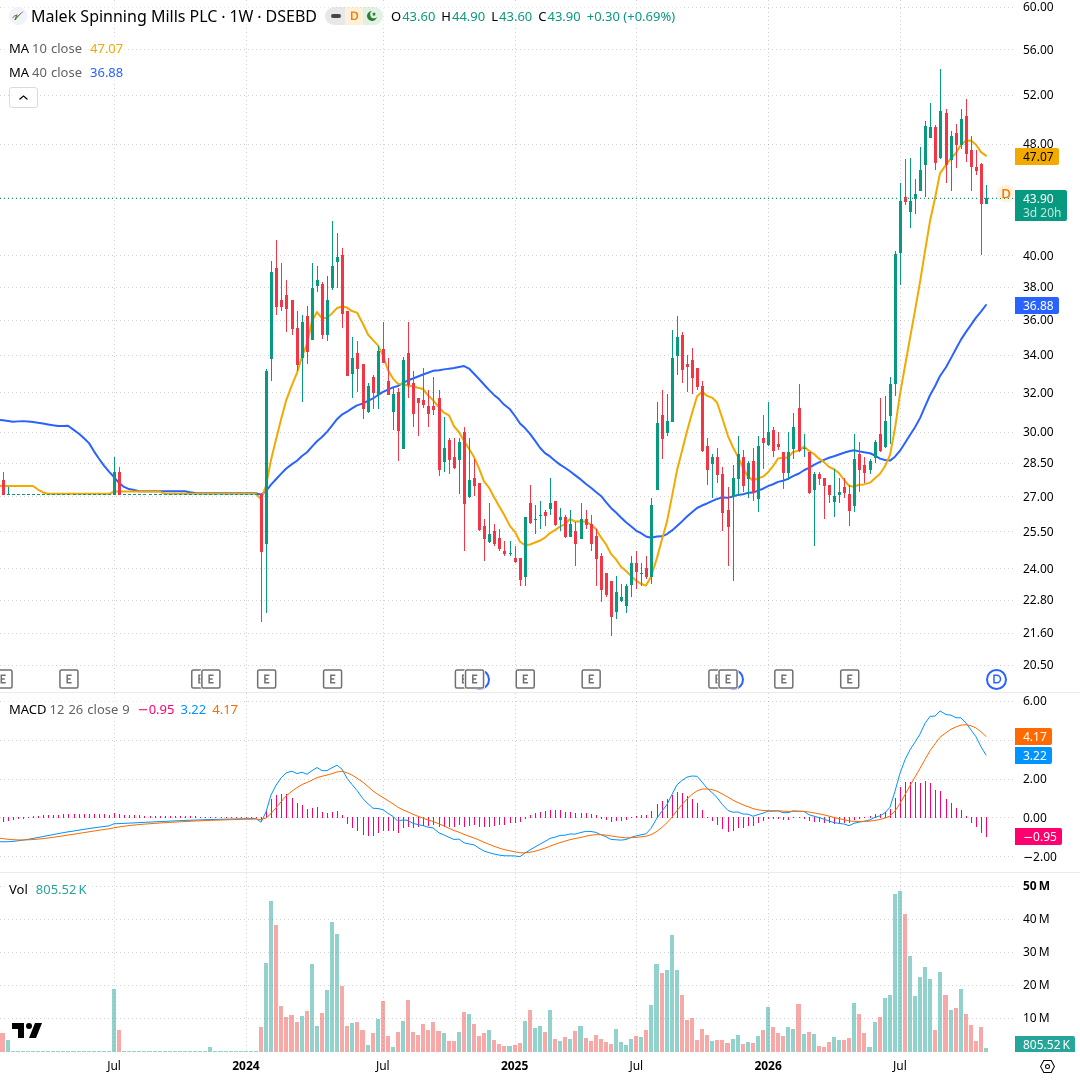
Each candle is one week. The orange line is the 10-week average (৳47.07), the blue line the 40-week average (৳36.88); below are MACD (12, 26, 9) and volume. Price jumped from ৳32.40 to ৳40.10 in the week of 28 June on 47.5 million shares, then held ৳44-51 for three months. The last two weeks dropped below the 10-week line, touching ৳40.00, and the MACD line (3.22) is now under its signal (4.17), while volume has faded.
Daily Down
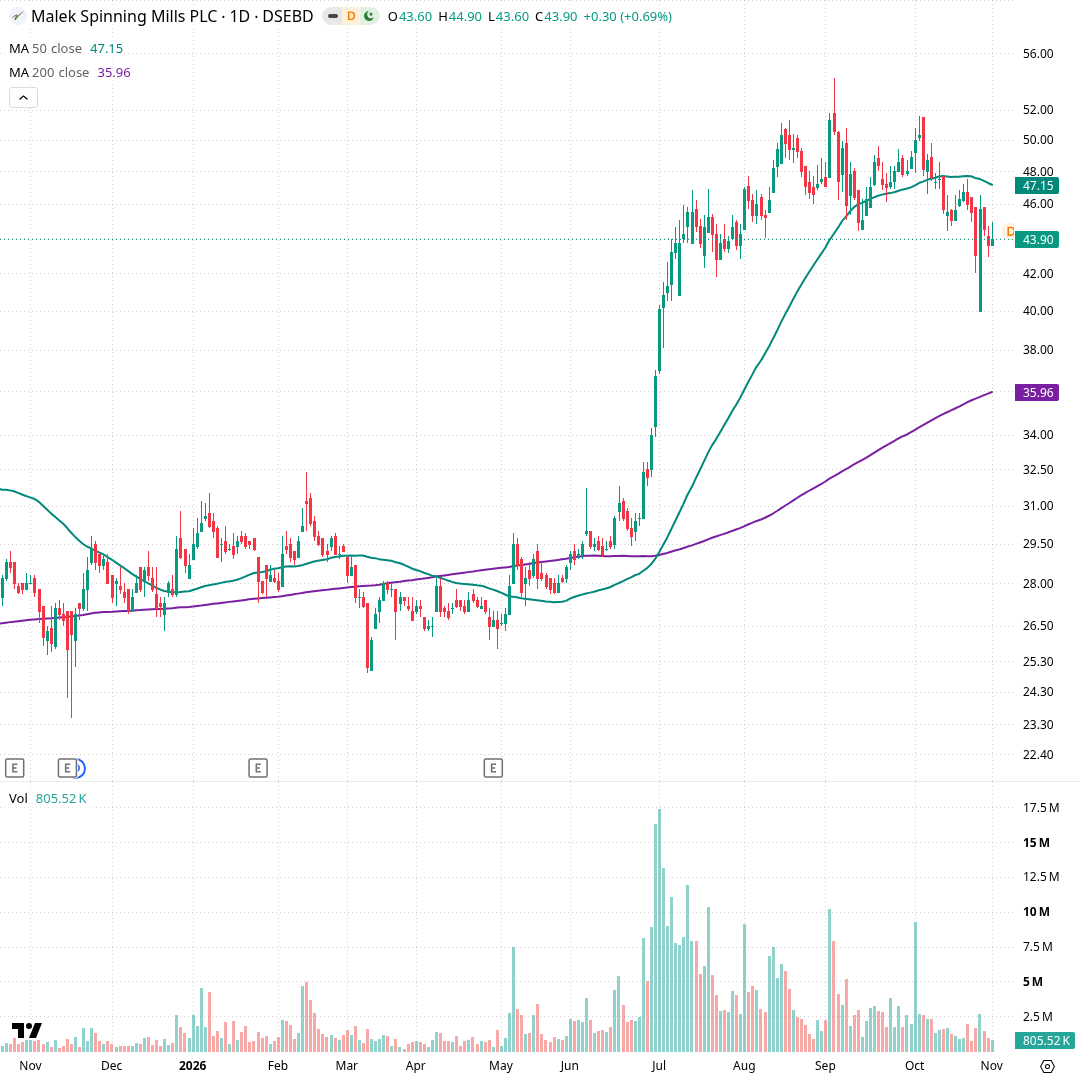
Each candle is one trading day over about a year. The green line is the 50-day average (৳47.15), the purple line the 200-day average (৳35.96); bottom panel is volume. Price ranged ৳25-32 until June, then surged to ৳45.50 by mid-July on volumes up to 17.4 million shares. It peaked at ৳54.20 on 3 September and again near ৳51.60 on 4 October, then slid below the 50-day line; a 27 October drop to ৳40.00 closed back at ৳45.70.
Hourly Down
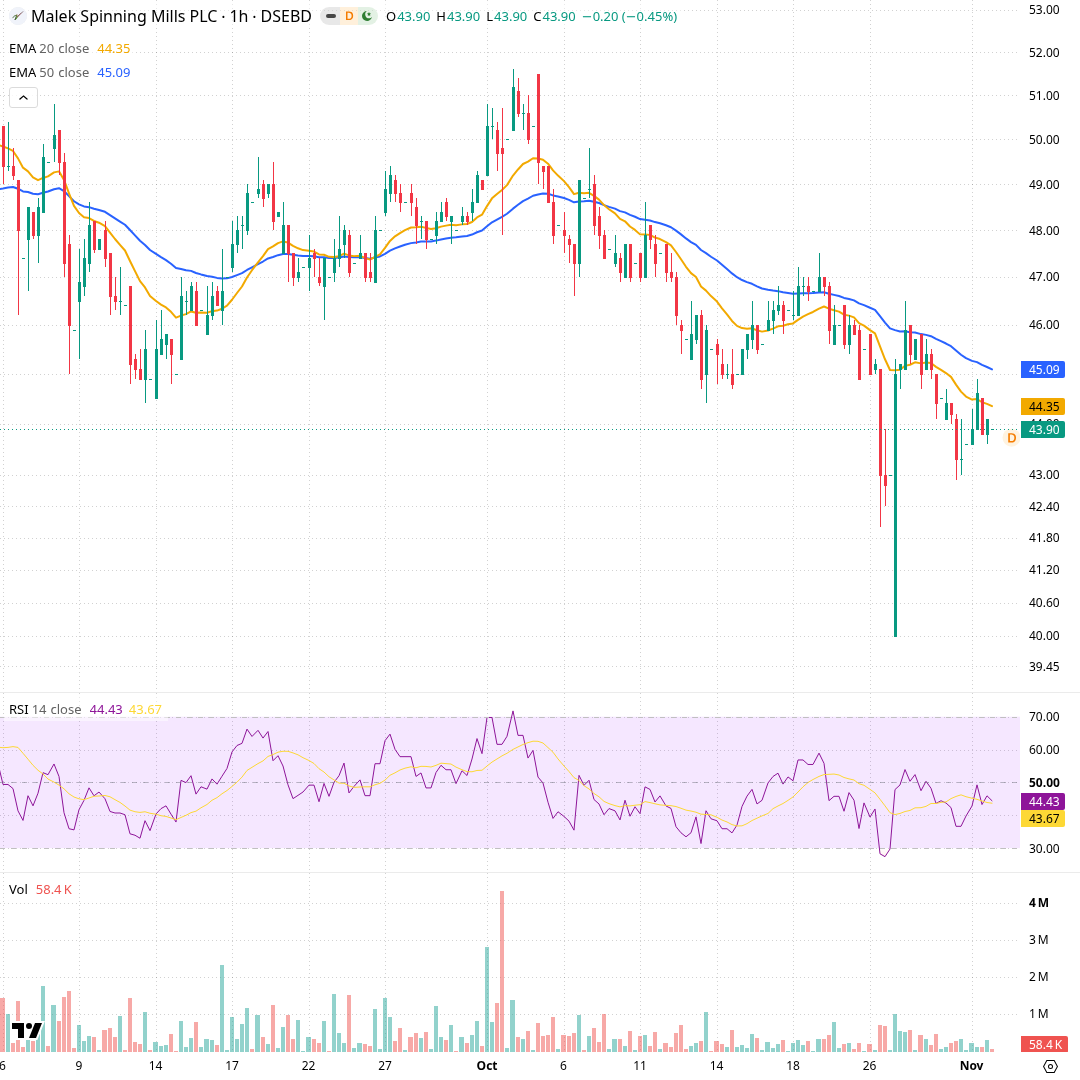
Each candle is one trading hour across about two months. The orange line is the 20-hour exponential average (৳44.35) and the blue line the 50-hour one (৳45.09); below are RSI 14 (44.43) and volume. After topping near ৳51.60 in early October, price made lower highs and lower lows, briefly spiking down to ৳40.00 on 27 October. It now sits at ৳43.90, below both averages, with light hourly volume.
Momentum and volume
Momentum has cooled. RSI, a 0-100 gauge of recent gains versus losses, is 41.5, below the midpoint. MACD sits below its signal line, and the selling-pressure line in DMI leads. Trading volume is low, at about 0.41 times average, so recent declines have come on thinner activity than the summer rally.
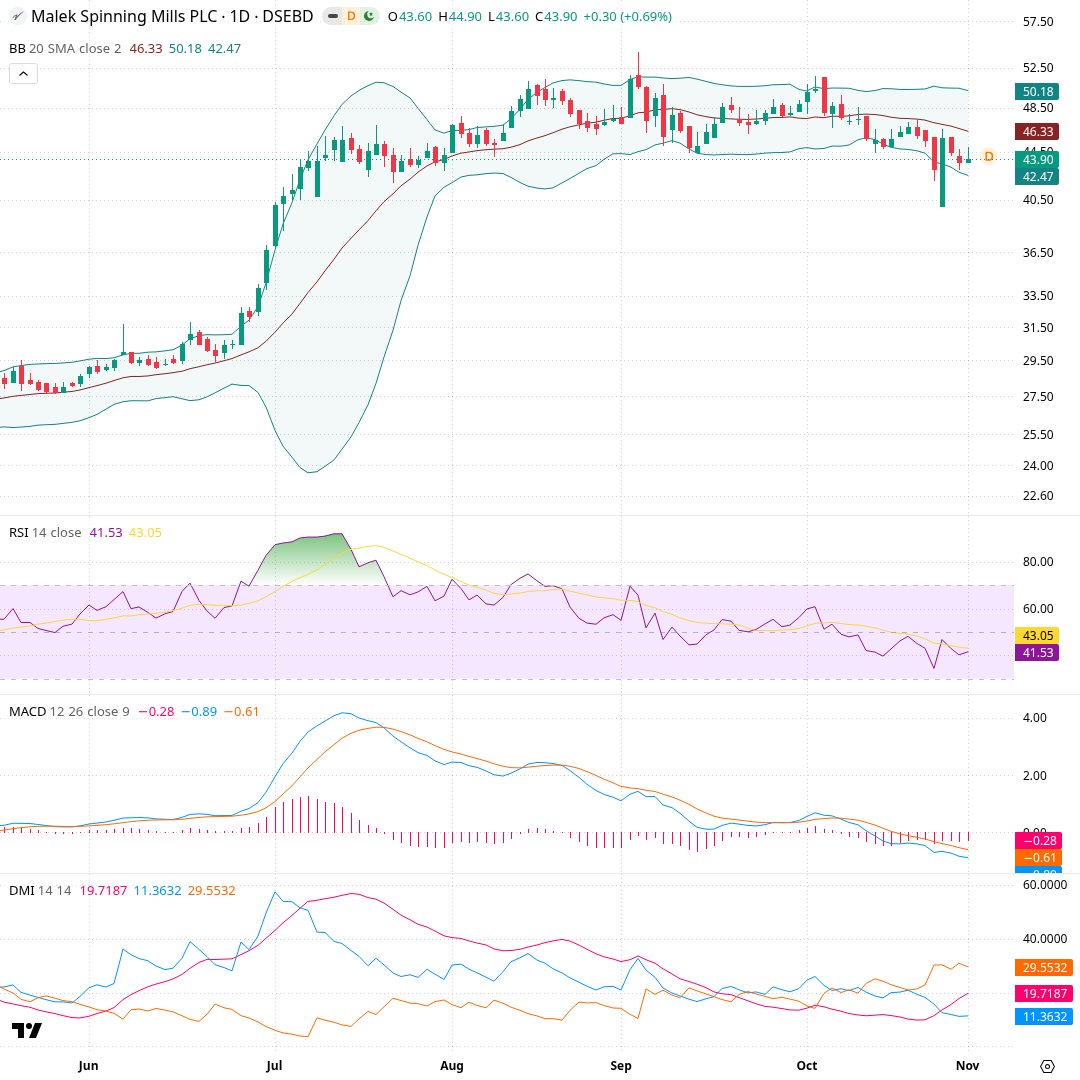
Each candle is one trading day over about six months. Bollinger Bands (20-day average ৳46.33, bands ৳42.47 and ৳50.18) show how far price strays from normal. RSI 14 (41.53) peaked above 80 in July and has drifted lower since. MACD (-0.89) has been below its signal line through October. In the DMI panel, the downward line (29.55) leads the upward line (11.36), and ADX at 19.72 says trend strength is still modest.
What would change the picture
The scenario cards describe what certain closing prices would mean for the chart's structure. They are conditions to watch, not predictions. Each one simply links a price level to the part of the chart it would change.
- Computed from daily closing prices (method t1, wording agent-2); history kept from 2026-11-01.
- Describes price history only. Not investment advice, not a rating or a price target.