Jute Spinners Limited (JUTESPINN) technical report
As of the 2026-11-01 close. Updated every trading day. Company page · All DSE stocks: technical data
In plain words
Jute Spinners has spent most of the past year moving sideways between about ৳190 and ৳260. Three times this year (March, May and July) it jumped to ৳260 on heavy trading and each time fell back. Since August the price has slowly sagged, and in October it slipped below both its 50-day average (the average closing price of the last 50 trading days, now ৳206.78) and its 200-day average (the last 200 trading days, ৳212.73). On 1 November it dropped as low as ৳176.50 during the day before closing at ৳186.90, down 4.2%. That close is below the ৳190–192 area that stopped every fall this year, so the bottom of the range has been broken. The stock is now 28.1% under its 52-week high of ৳260. The levels that matter are ৳190–192 overhead, now a ceiling to recover, and ৳176.50 and ৳171 (last November's low) beneath.
Key levels
Support is a price where falls have stopped before; resistance is where rises have stalled. On this stock ৳260 capped three rallies in 2026, while ৳190–192 caught every drop from January to October. This week price closed below that floor, so ৳190–192 now acts as a ceiling, and the next floors are today's ৳176.50 low and the ৳171 low from November 2025.
Trend on each timeframe
All four views point the same way. The monthly chart shows a long slide from the 2023 peak and a close under the 12-month average. The weekly 10-week average has crossed under the 40-week. The daily price is below both the 50- and 200-day lines, and the hourly averages are falling above price. The only difference is pace: hourly and daily RSI are near oversold, the monthly is a milder 42.
Monthly Down
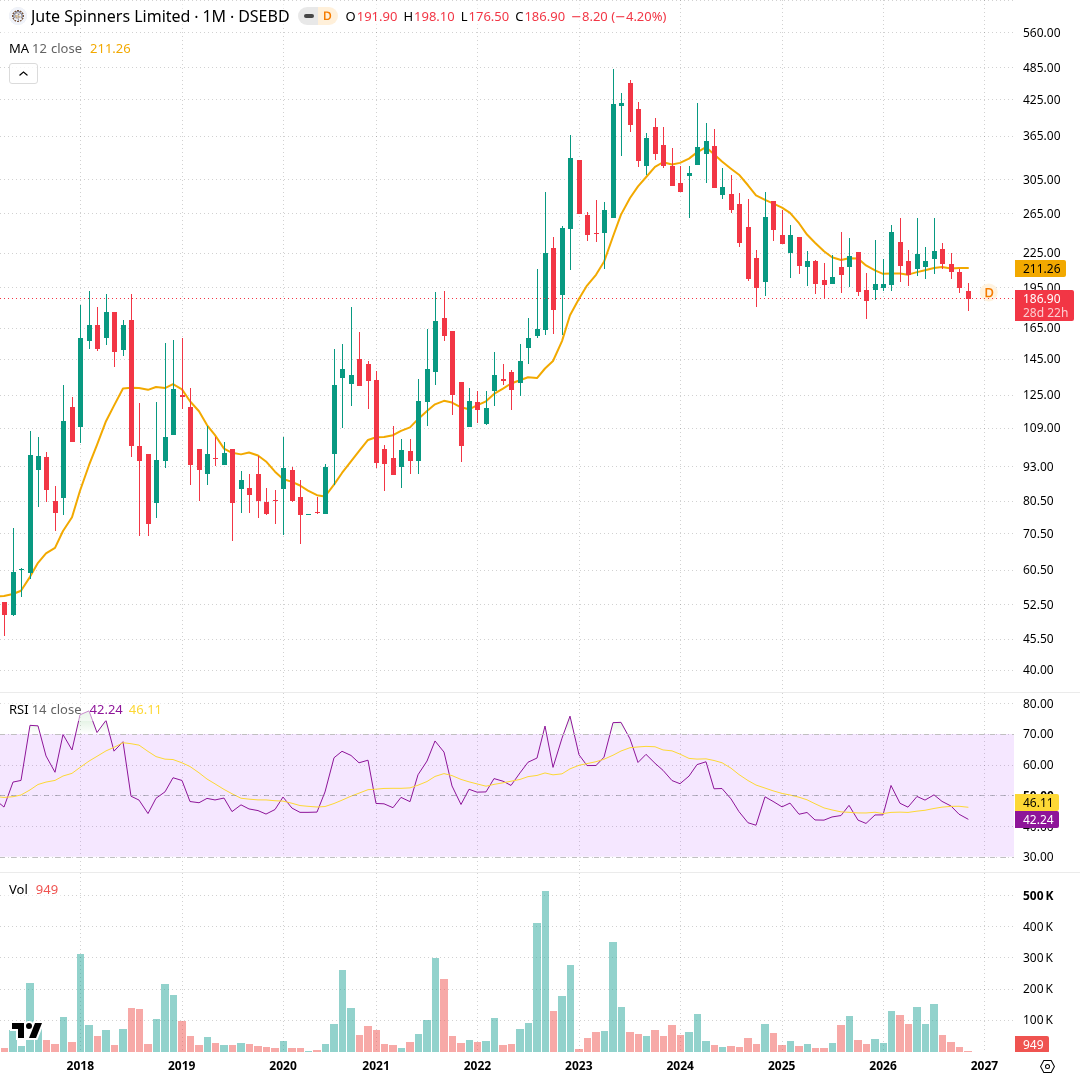
Each candle is one month, covering about ten years. The orange line is the 12-month simple average (৳211.26), the panel below is RSI (14), a 0–100 momentum gauge, and the bottom panel is monthly volume. The stock climbed from under ৳60 in 2017 to a 2023 peak near ৳485, then slid through 2024 and has moved sideways between roughly ৳171 and ৳260 since late 2024. The November candle so far runs ৳176.50–৳198.10 and sits below the 12-month line; monthly RSI is 42.2, under its 46.1 average.
Weekly Down
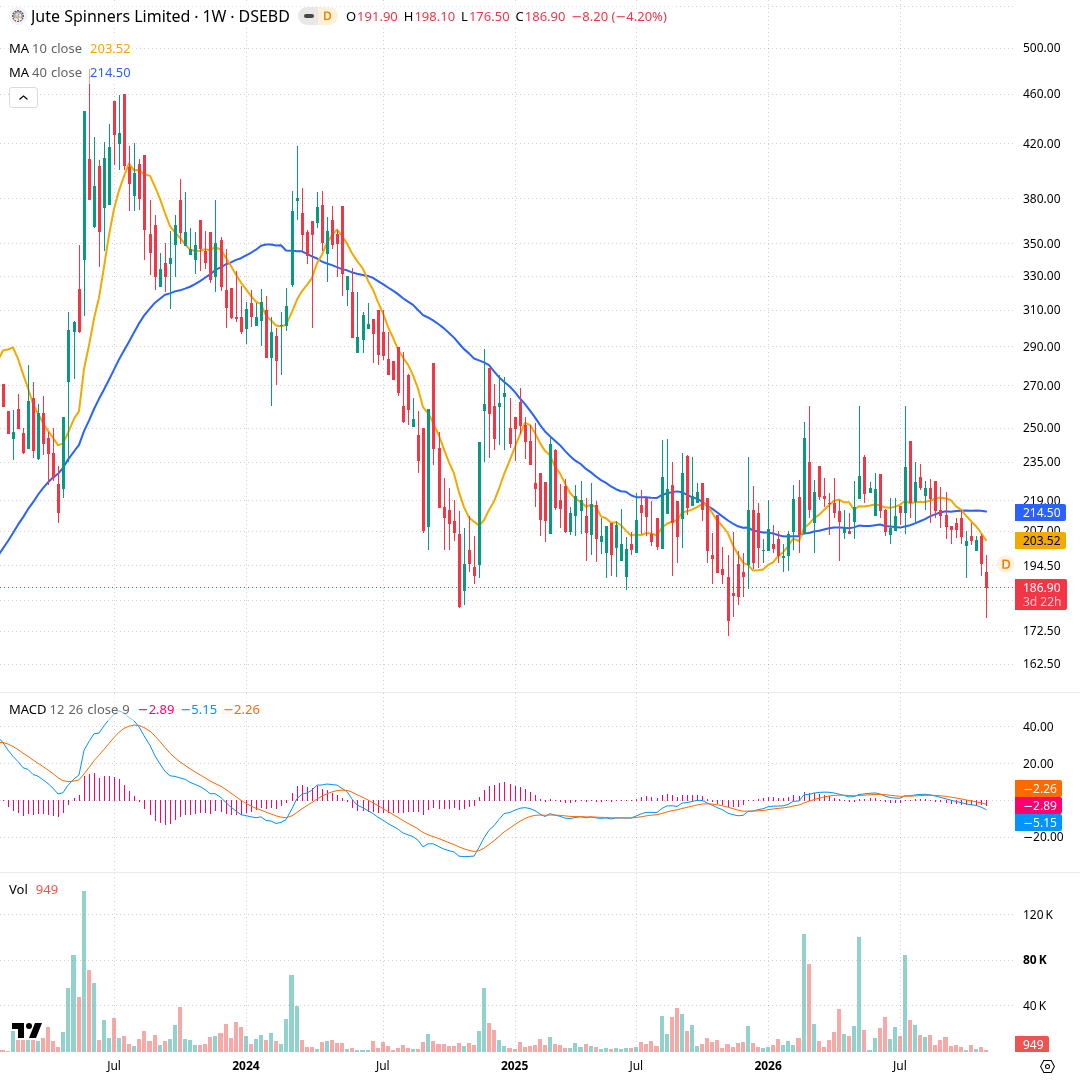
Each candle is one week. The orange line is the 10-week average (৳203.52), the blue line the 40-week average (৳214.50); the MACD panel compares a fast and slow average to show momentum, and the bottom panel is weekly volume. Through 2026 price swung between about ৳190 and ৳260, with heavy-volume spikes in late February (102,403 shares), May (99,783) and July (84,321) that each faded. Since August the weekly closes stepped down from ৳232.50 to ৳186.90, the 10-week line has turned below the 40-week, and MACD (−5.15) is below its signal (−2.26).
Daily Down
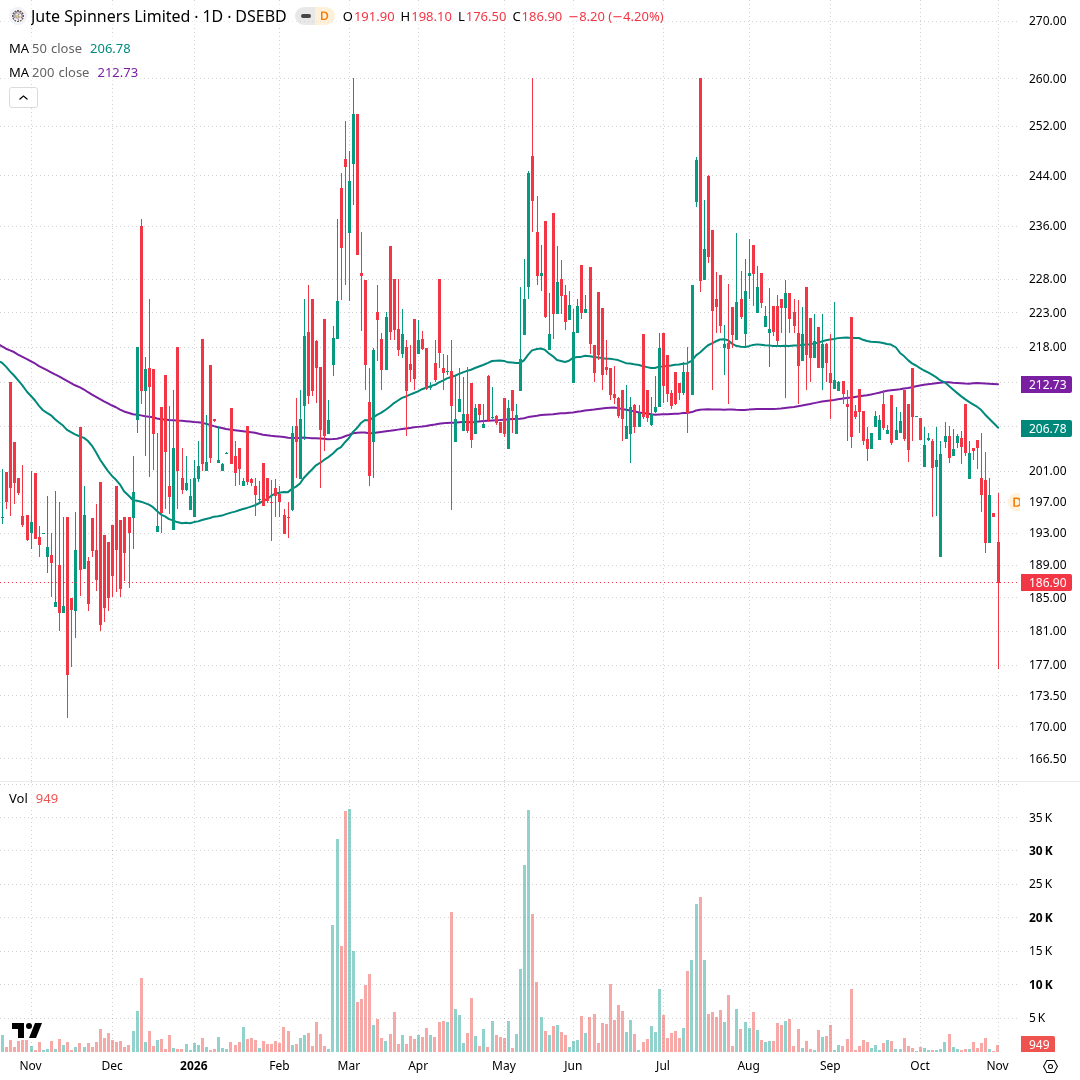
Each candle is one trading day, covering about a year. The green line is the 50-day average (৳206.78) and the purple line the 200-day average (৳212.73), the average close of the last 200 sessions. Price bounced off ৳171 in November 2025, then ranged ৳192–৳260 with three spikes to ৳260 in March, May and July on volume above 20,000 shares. From August it drifted lower, the 50-day crossed below the 200-day in October, and today it dipped to ৳176.50 before closing at ৳186.90 on 949 shares.
Hourly Down
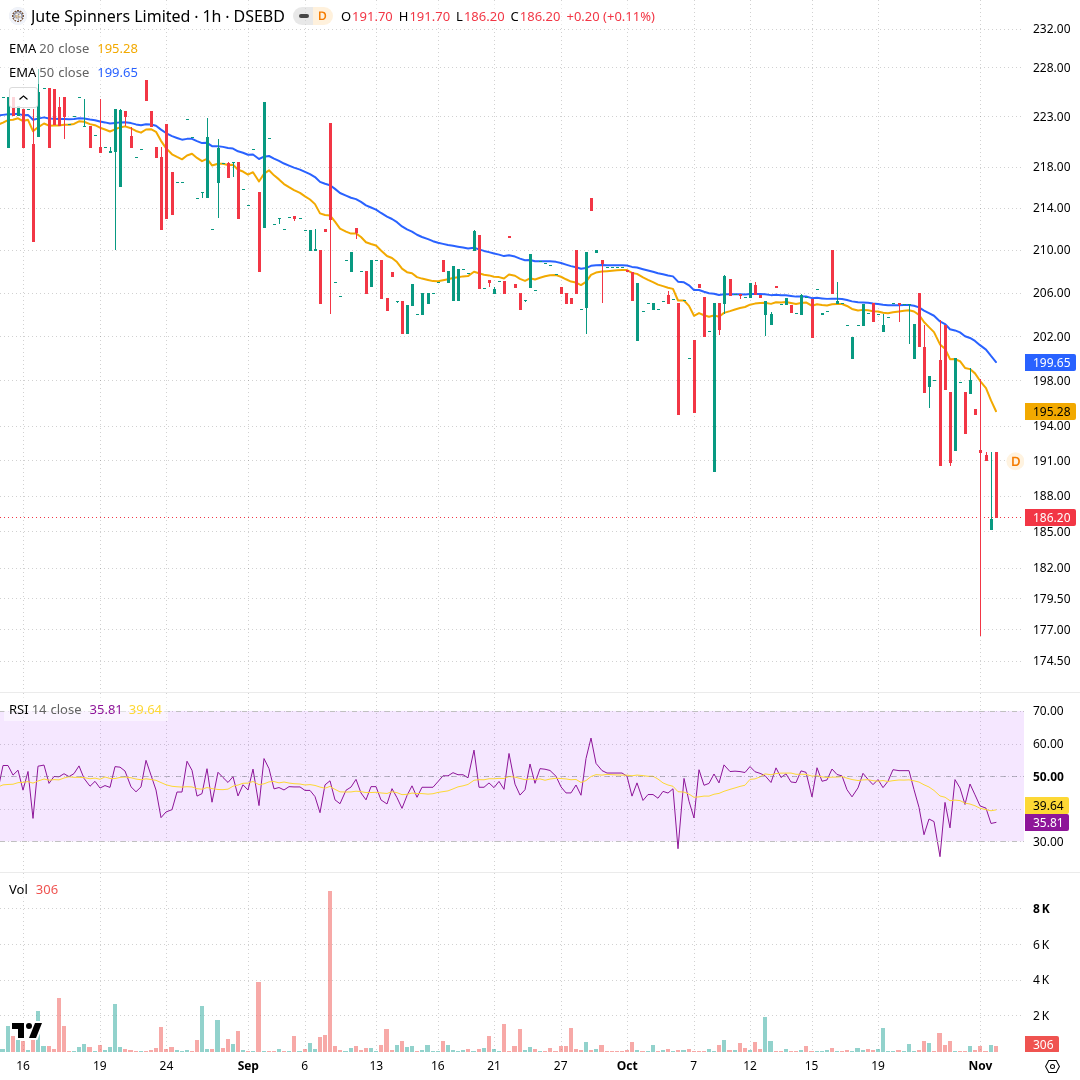
Each candle is one trading hour, covering mid-August to today. The orange line is the 20-hour exponential average (৳195.28) and the blue line the 50-hour average (৳199.65); RSI (14) and hourly volume are below. Price slid from around ৳223 in August to a ৳202–৳210 shelf through September and October, then broke lower in the last week. Today one hour wicked to about ৳177 before the last hour closed at ৳186.20, with both averages above price and pointing down; hourly RSI is 35.8.
Momentum and volume
Selling pressure has picked up. Daily RSI at 29.4 means recent falls have far outweighed recent gains, and MACD is below its signal line and widening. ADX at 30 says the move has real direction, and that direction is down (−DI 39.9 vs +DI 7.9). Price also sits below the lower Bollinger band. The stock trades thinly, so single sessions can swing a lot.
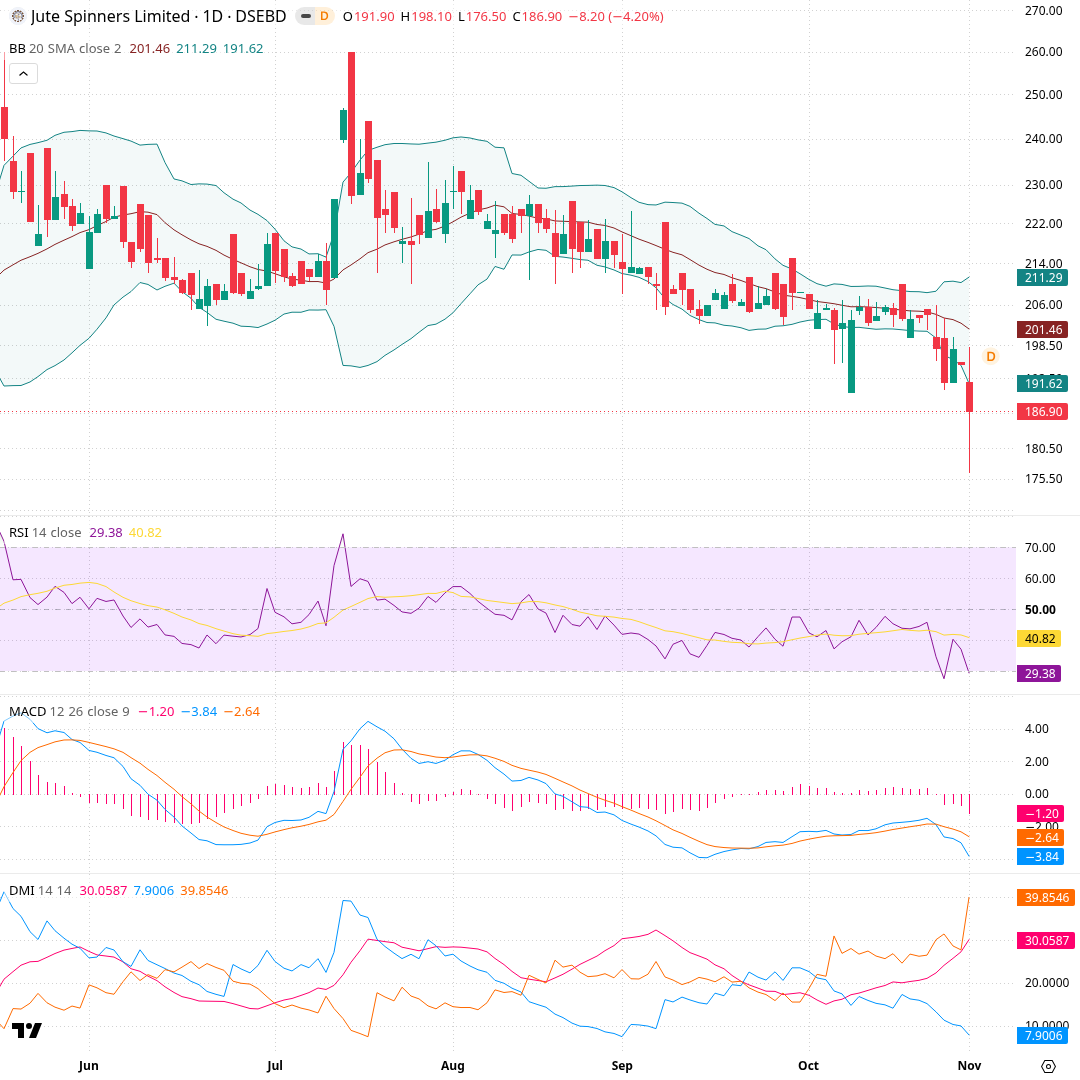
Each candle is one trading day from late May to today. The shaded channel is Bollinger Bands: a 20-day average (৳201.46) with bands two standard deviations above (৳211.29) and below (৳191.62). Below are RSI (29.4), MACD (−3.84 vs signal −2.64) and ADX/DMI, which measures trend strength (30.1) and direction (+DI 7.9, −DI 39.9). After the July spike to ৳260, the bands narrowed as price drifted down through September and October. This week price closed outside the lower band, RSI dropped under 30, and ADX rose with −DI near 40.
What would change the picture
Each scenario card names a price and what a daily close past it would mean for the chart's structure. They are conditions to watch, not predictions: they do not say which will happen, only how the picture would change if one does.
Recent changes and what followed
Each row is a day a tracked signal changed, and the price move over the next 5, 20 and 60 trading days (blank until that many days have passed). Past moves do not predict future ones.
| Date | Change | Close | Next 5 days | Next 20 days | Next 60 days |
|---|---|---|---|---|---|
| 2026-11-01 | RSI fell to 30 or below | ৳186.90 | |||
| 2026-11-01 | Closed below the nearest support level | ৳186.90 |
- Computed from daily closing prices (method t1, wording agent-2); history kept from 2026-11-01.
- Describes price history only. Not investment advice, not a rating or a price target.