Dragon Sweater & Spinning Limited (DSSL) technical report
As of the 2026-11-01 close. Updated every trading day. Company page · All DSE stocks: technical data
In plain words
Dragon Sweater & Spinning (DSSL) closed at ৳9.10 on November 1, up 2.25% on the day. Earlier this year the stock rose from about ৳7.60 in February to ৳14.80 in late July, helped by unusually heavy trading. Since then it has given most of that back, falling to ৳8.00 on October 27, about 38% below the July high. On October 29 it jumped about 13% in one session and has held near ৳9 since. The chart still points down on daily and weekly views: price is below the 50-day average (the average closing price of the last 50 trading days, ৳10.62) and the 200-day average (৳10.18), and each bounce since July has peaked lower than the one before. The levels that matter now are ৳8.00 below, the recent low, and ৳9.80 above, the high of the October 29 jump, with the ৳10.18–10.62 band of averages beyond that.
Key levels
Support is a price where buyers previously stepped in; resistance is where sellers did. For DSSL, ৳8.00 is the October 27 low that preceded the bounce, and ৳6.90–7.60 holds the lows of November 2025 and February 2026. Above, ৳9.80 capped the October 29 spike, and ৳10.18–10.62, where both daily averages sit, is the first band that price broke through on the way down.
Trend on each timeframe
The monthly chart shows a wide sideways range between about ৳7 and ৳15 that has lasted since 2024. Inside that range, the weekly and daily charts show a clear decline since July, with price under all their averages. The hourly chart is the exception: since October 29 it has steadied around ৳9.10 with its short averages flattening, a pause within the larger downtrend.
Monthly Sideways
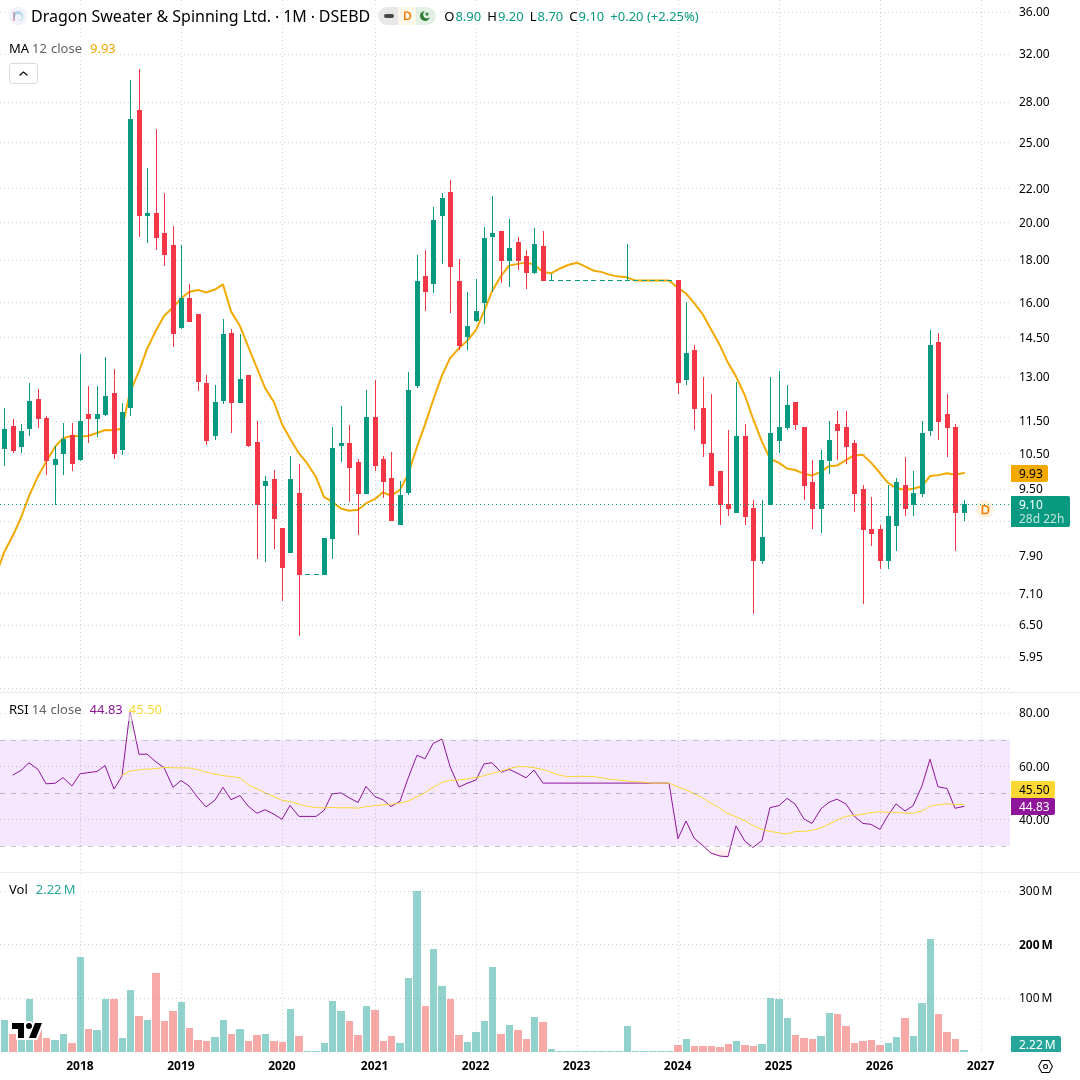
Each candle is one month, covering roughly ten years. The orange line is the 12-month simple average of closing prices; the lower panel shows RSI (14), a 0–100 gauge of recent gains versus losses, and the bottom panel shows monthly volume. After a long slide from about ৳17 in early 2024, price has moved sideways between about ৳7 and ৳15. A heavy-volume rally in July 2026 reached ৳14.80, then faded. The current ৳9.10 is just below the 12-month average of ৳9.93, and RSI reads 44.8, slightly under the midpoint.
Weekly Down
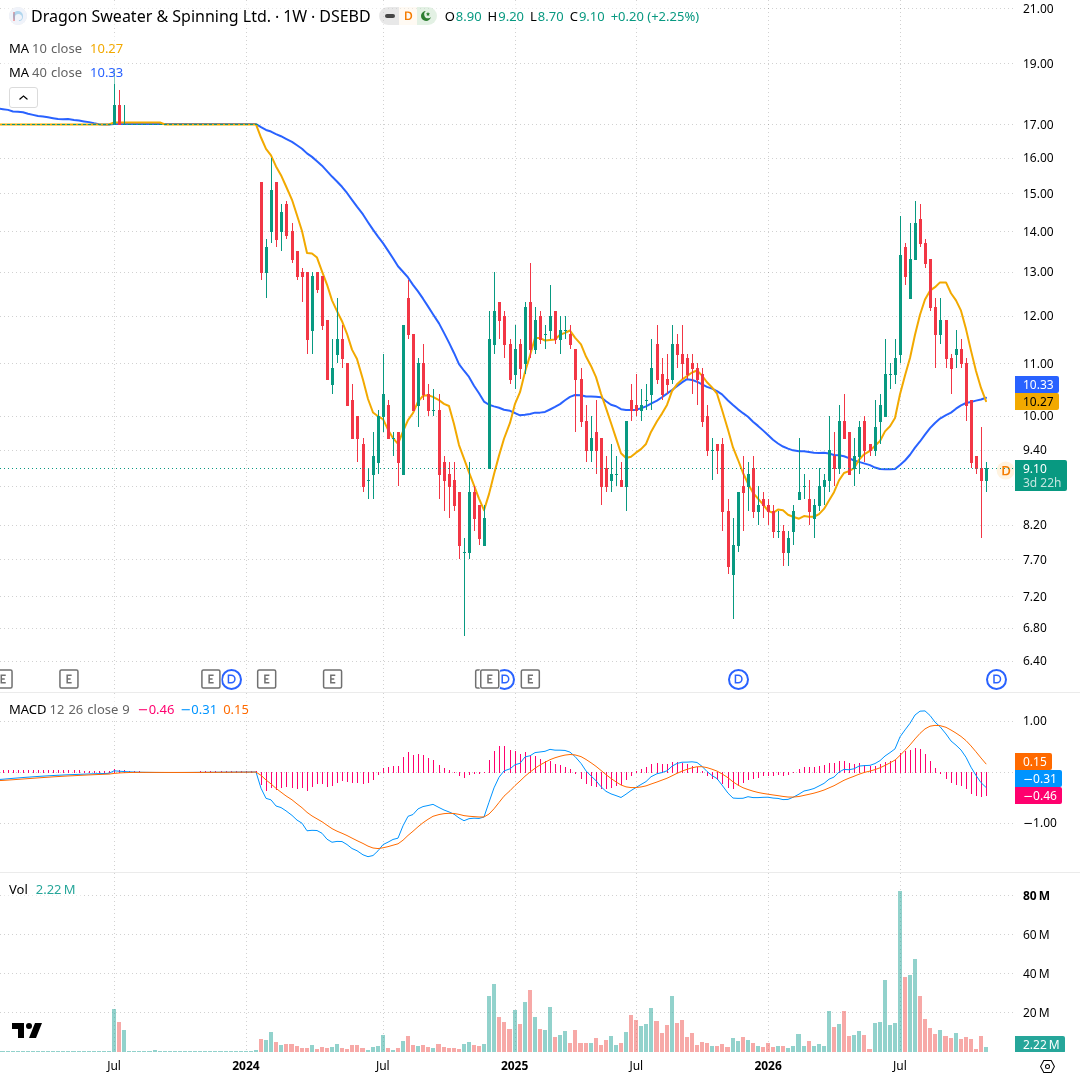
Each candle is one week. The orange line is the 10-week average and the blue line the 40-week average of closes; the MACD panel compares two exponential averages to show momentum, and the bottom panel shows weekly volume. The week of July 5, 2026 traded 82.3 million shares as price broke from about ৳11 to ৳14.40; the high came at ৳14.80 in late July. Since then weekly closes fell from ৳14.20 to ৳8.90, slipping under both averages, which now sit near ৳10.30. MACD has turned negative at -0.31, below its signal line at 0.15.
Daily Down
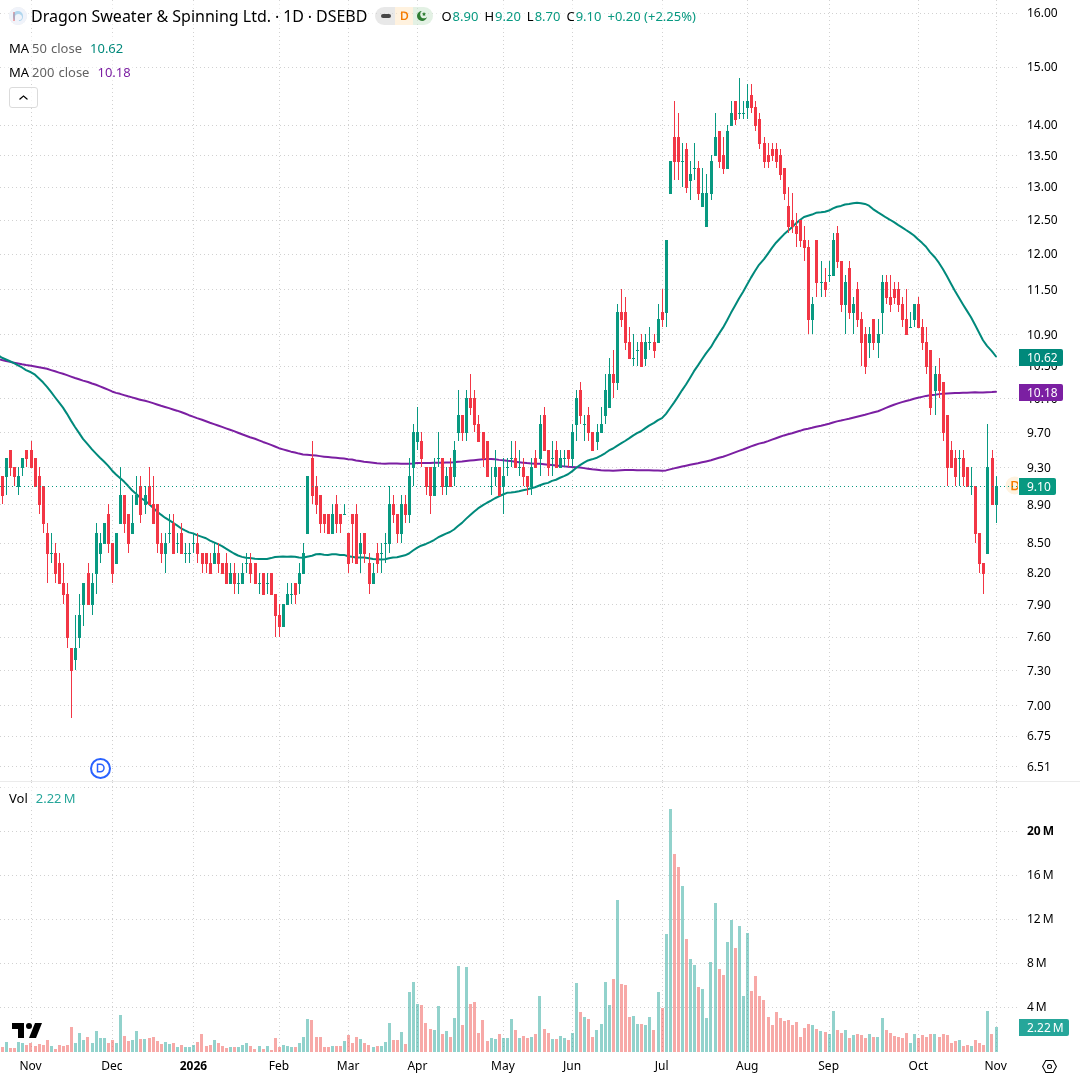
Each candle is one trading day over about a year. The green line is the 50-day average and the purple line the 200-day average of closing prices; volume is shown below. Price climbed from ৳7.60 in February to ৳14.80 in late July on daily volume up to 22 million shares, then declined steadily. It fell under the 200-day average (৳10.18) in mid-October and touched ৳8.00 on October 27. On October 29 it jumped to ৳9.30 (high ৳9.80) on 3.6 million shares. The 50-day average (৳10.62) is now falling toward the 200-day.
Hourly Sideways
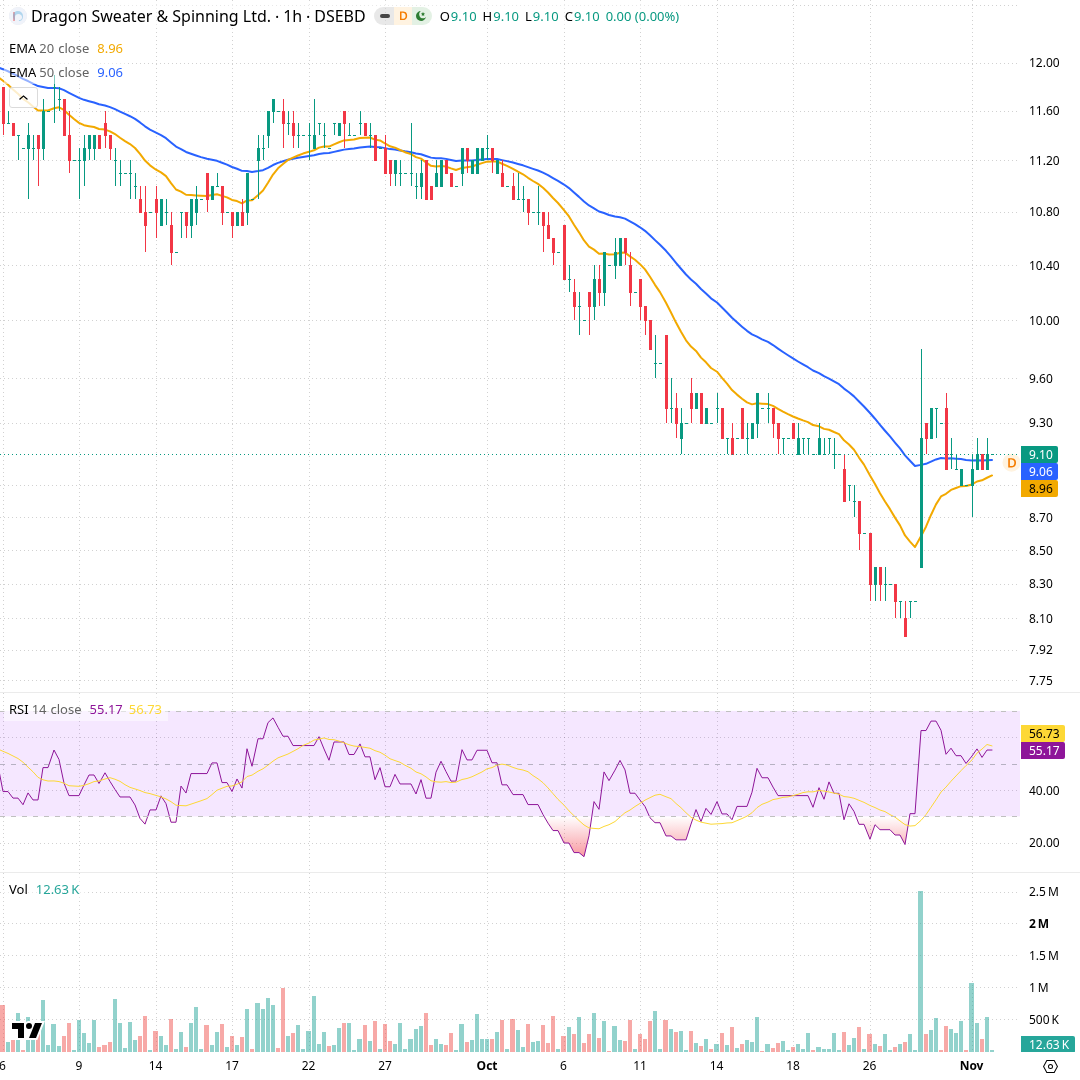
Each candle is one hour of trading over roughly the past two months. The orange line is the 20-hour exponential average and the blue line the 50-hour exponential average; RSI (14) and hourly volume are below. Price slid from about ৳11.50 in late September to ৳8.00 on October 27, staying under both lines. A single hour on October 29 carried about 2.5 million shares and lifted price to ৳9.80. Since then it has held between ৳8.70 and ৳9.40, with the two averages flattening at ৳8.96 and ৳9.06 and RSI near 55.
Momentum and volume
Selling pressure has been strong: ADX, a gauge of trend strength, reads 37.4 with the sellers' line on top. RSI fell near 25 in late October, a stretched reading, and has recovered to 41.8. MACD has just stopped falling. Volume on the bounce days was well above normal, so buying interest appeared at ৳8, though it has not yet changed the trend.
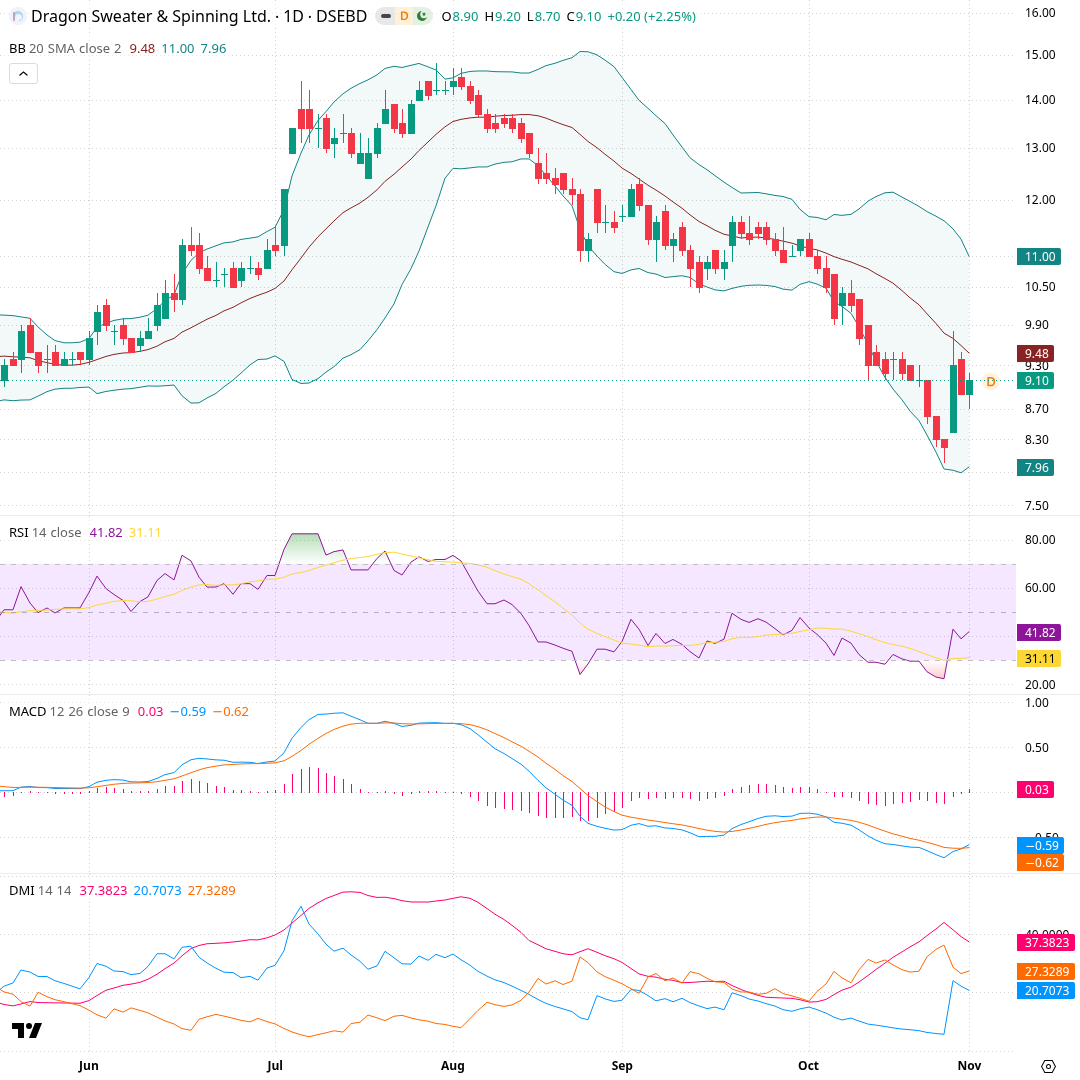
Each candle is one trading day over about six months. The shaded channel is Bollinger Bands: a 20-day average (middle, ৳9.48) with bands two standard deviations above (৳11.00) and below (৳7.96). Below are RSI (14), MACD and ADX with its +DI/-DI lines, which measure trend strength and direction. Price rode the upper band into the July peak, then walked down the lower band from August. RSI dipped near 25 in late October and is now 41.8. MACD (-0.59) has just edged above its signal (-0.62). ADX at 37.4 with -DI above +DI shows a strong downtrend.
What would change the picture
The scenario cards describe what a given closing price would mean for the chart's structure. They are conditions to watch, not predictions, and price can stay between the levels for some time.
Recent changes and what followed
Each row is a day a tracked signal changed, and the price move over the next 5, 20 and 60 trading days (blank until that many days have passed). Past moves do not predict future ones.
| Date | Change | Close | Next 5 days | Next 20 days | Next 60 days |
|---|---|---|---|---|---|
| 2026-11-01 | MACD crossed above its signal line | ৳9.10 | |||
| 2026-10-29 | Closed below the nearest support level | ৳8.90 |
- Computed from daily closing prices (method t1, wording agent-2); history kept from 2026-10-29.
- Describes price history only. Not investment advice, not a rating or a price target.