Dominage Steel Building Systems Ltd. (DOMINAGE) technical report
As of the 2026-11-01 close. Updated every trading day. Company page · All DSE stocks: technical data
In plain words
Dominage Steel's share price had a very large rise: from under ৳10 in mid-2025 to a peak of ৳89.70 on 29 July 2026. In August it fell fast, losing about a quarter of its value in a few days, to around ৳62. Since then, for about ten weeks, the price has gone sideways, mostly between ৳59 and ৳70, and it closed today at ৳62.90, up 1.78%. Two averages help place this. The 50-day average (the average closing price of the last 50 trading days) is ৳62.86, almost exactly where the price is. The 200-day average (the average of the last 200 closes, a slow long-term line) is ৳58.67 and is still rising, so the long-term picture still sits below the price. The levels that matter now are the top of the sideways band near ৳68–৳70 and its floor near ৳56–৳59. Trading has been quiet: today's volume is less than half the recent average.
Key levels
Support is a price area where buying has stopped falls before; resistance is where rises have stalled. On Dominage, ৳68.10–৳69.90 capped rallies in September and October, while ৳56.10 (7 September) and ৳59.30 (26 October) marked the lows. The 200-day average at ৳58.67 sits just below that floor.
Trend on each timeframe
The monthly chart still shows a big uptrend, with price well above its 12-month average. The weekly and daily charts are flat: price is tangled with its averages after the August drop. The hourly chart has turned up over the last week. So the long view is up, the medium view is sideways, and the short view is improving.
Monthly Up
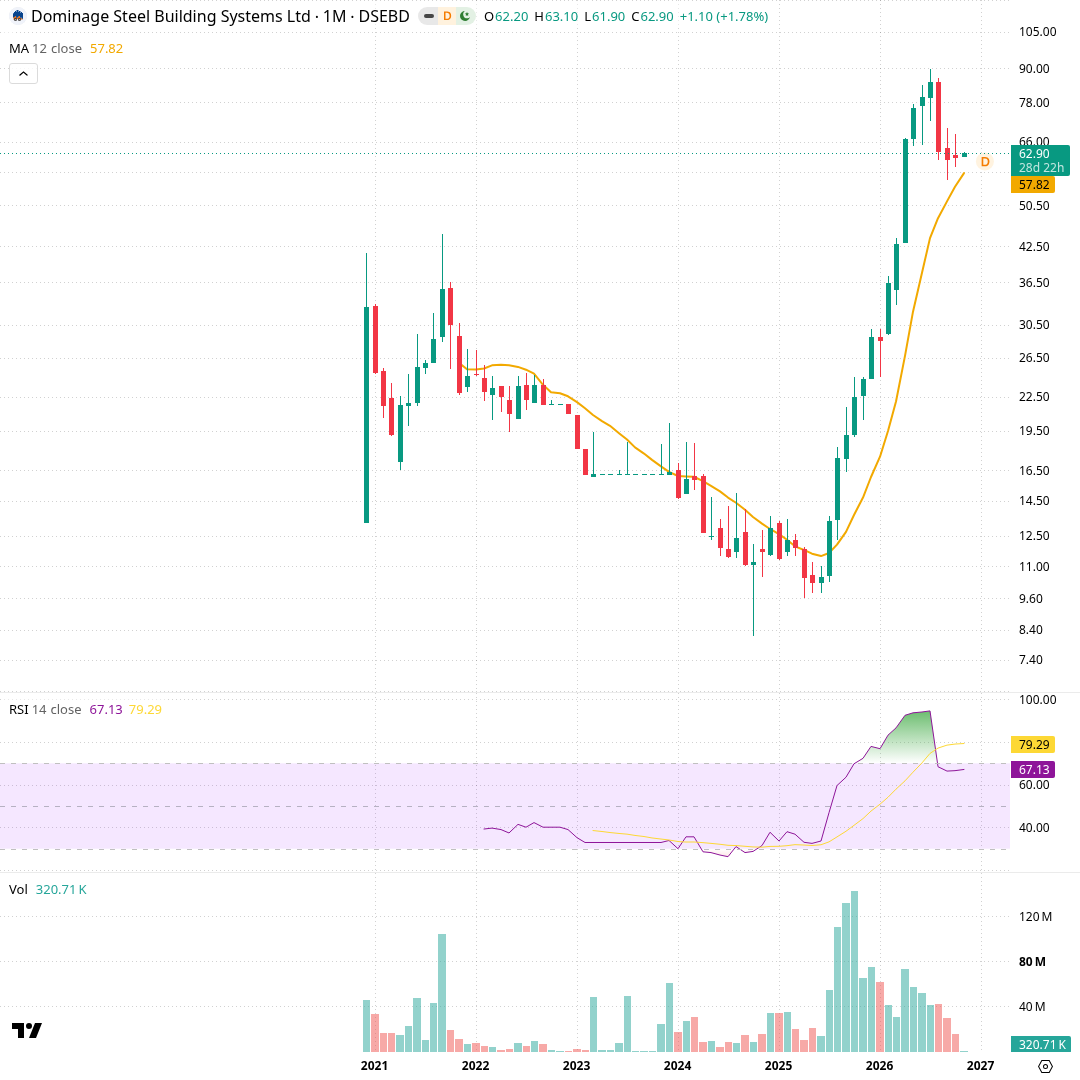
Each candle is one month, covering the stock's history since 2021. The orange line is the 12-month simple moving average (৳57.82), the average close of the last year. The lower panel is RSI, a 0–100 momentum gauge, now 67.1 after peaking above 90. Price slid from about ৳40 in 2021 to under ৳10 in 2025, then rallied almost every month to a ৳89.70 high in July 2026. August to October closed lower, near ৳62–৳65, still above the 12-month line. Volume was heaviest during the 2025–2026 rally and has dropped off since.
Weekly Sideways
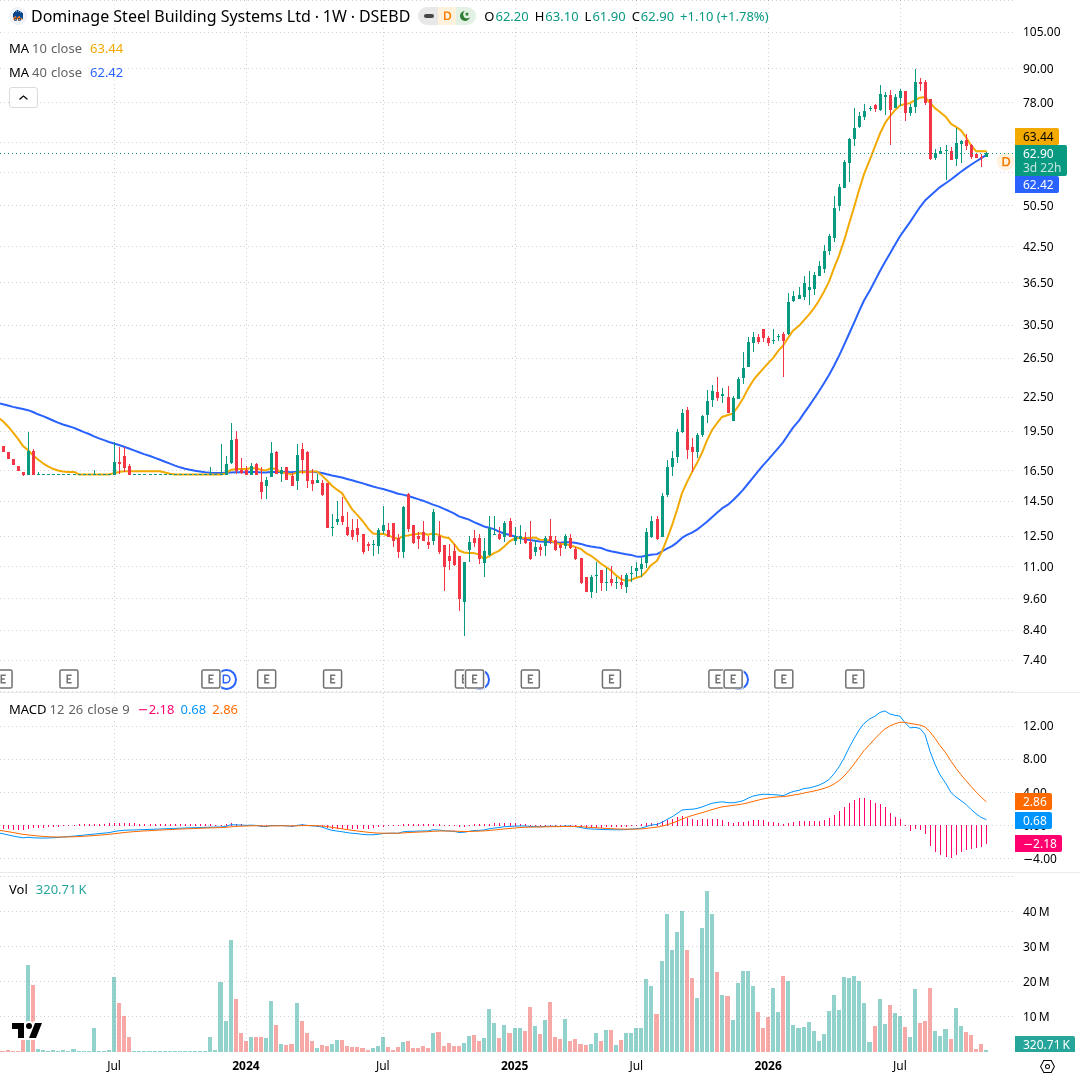
Each candle is one week, covering roughly four years. The orange line is the 10-week average (৳63.44) and the blue line the 40-week average (৳62.42). Below is MACD, which compares a fast and slow average to show momentum: the MACD line (0.68) is below its signal line (2.86). The stock climbed from ৳9.60 in mid-2025 to a ৳89.70 weekly high in late July 2026. The week of 13 August fell from ৳79.00 to ৳61.70 on 18.1 million shares. Since then weekly closes stay between ৳61.30 and ৳66.10, with the two averages converging right at the price.
Daily Sideways
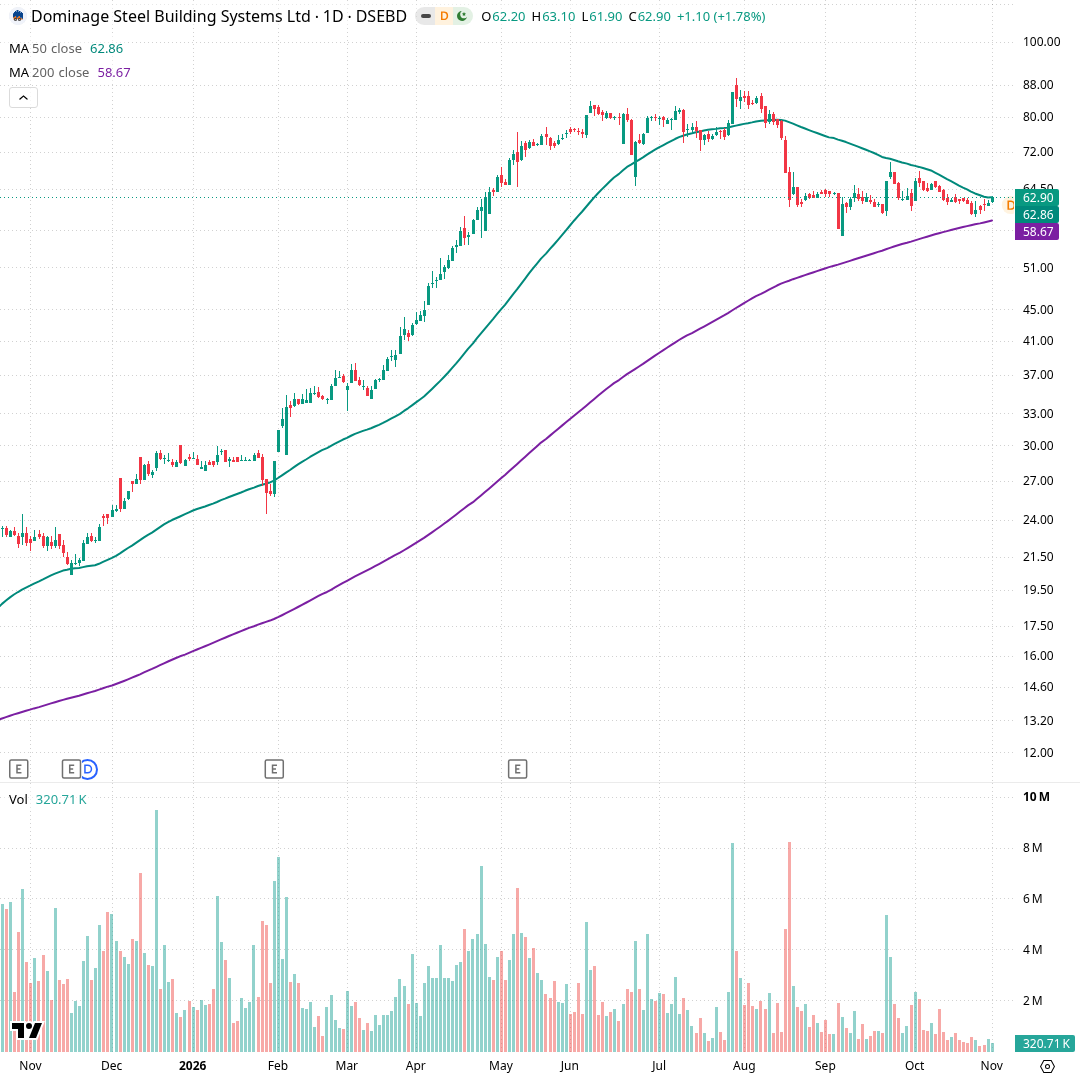
Each candle is one trading day, covering about a year. The green line is the 50-day average (৳62.86) and the purple line the 200-day average (৳58.67). Price rose steadily from about ৳21 in November 2025 to ৳89.70 on 29 July 2026, then dropped to ৳62.60 by 18 August on 8.2 million shares. Since then it has moved sideways, with a low of ৳56.10 on 7 September and a high of ৳69.90 on 23 September. The 50-day line is now falling toward the price while the 200-day line still rises. Recent daily volume is light, 320,709 shares today.
Hourly Up
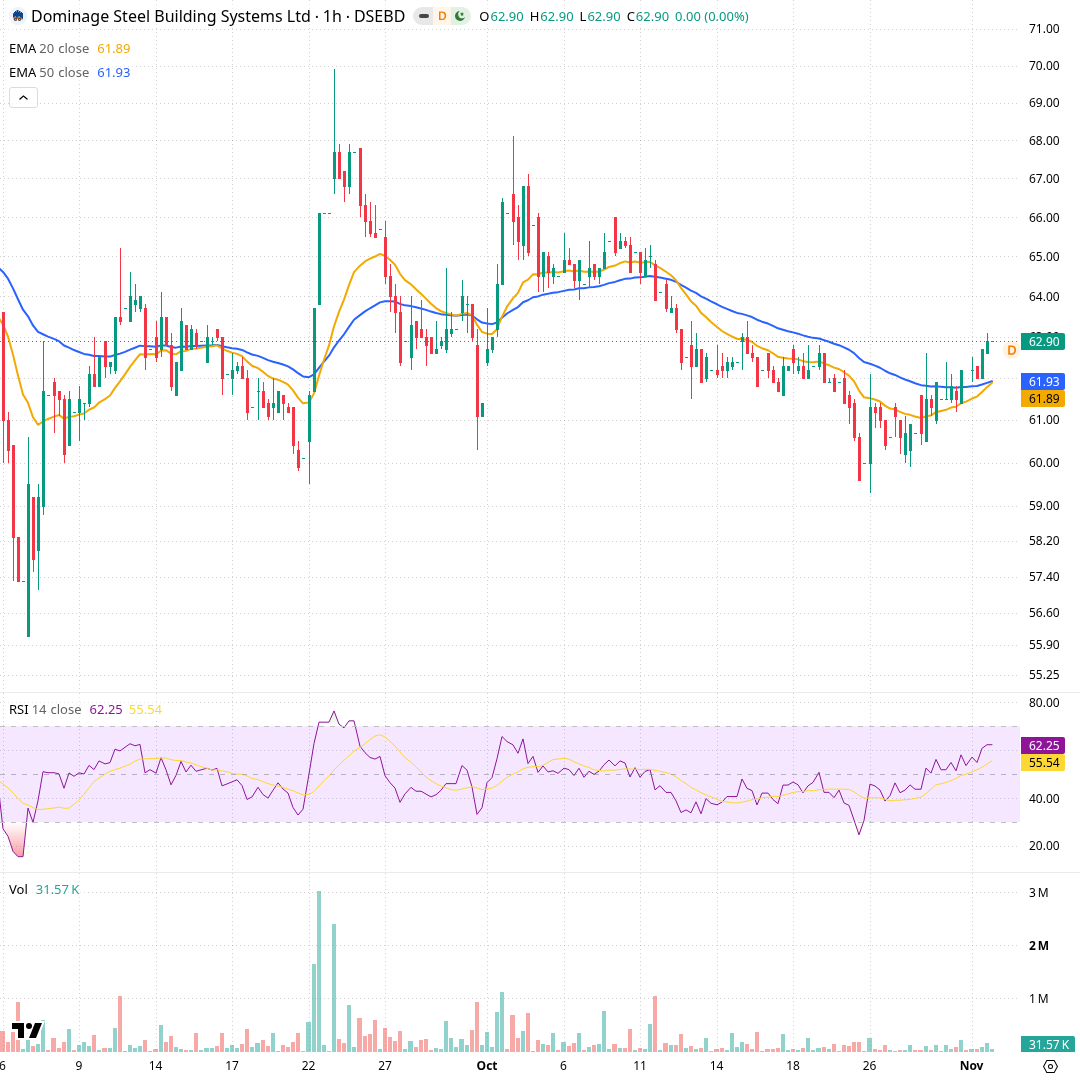
Each candle is one trading hour, covering about two months. The orange line is the 20-hour exponential average (৳61.89) and the blue line the 50-hour one (৳61.93); both weight recent prices more. The lower panel shows RSI at 62.3. Price spiked to about ৳70 on 23 September, faded through October to a ৳59.30 low on 26 October, and has since climbed back above both averages to ৳62.90. Hourly volume has been thin during this recovery, well below the late-September burst.
Momentum and volume
Momentum readings are neutral. RSI is at 50, the midpoint, after being very weak in early September. MACD is near zero, and ADX at 19 says there is no strong trend in either direction. The Bollinger Bands have narrowed a lot, which shows prices have become calm. Volume is light, so few shares are changing hands.
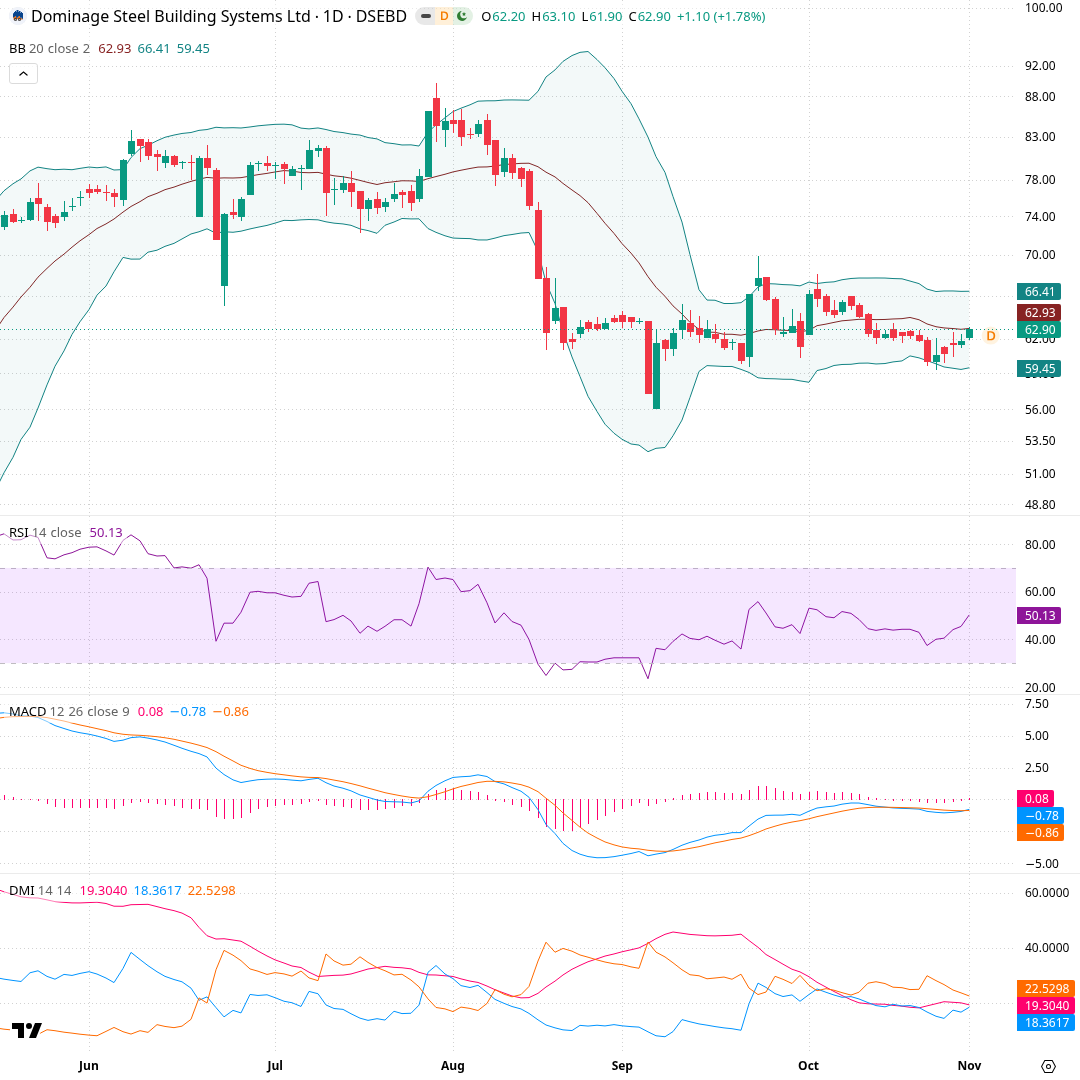
Each candle is one trading day, covering about six months. The shaded channel is Bollinger Bands: a 20-day average (৳62.93) with bands two standard deviations above (৳66.41) and below (৳59.45). Panels below show RSI (50.1), MACD (-0.78 vs signal -0.86) and the DMI/ADX trend-strength set (ADX 19.3). The bands widened during the August fall to ৳62.60, then narrowed as price settled into a ৳59–৳70 range. RSI recovered from about 25 in early September to the midpoint, and MACD has hovered near zero since October.
What would change the picture
The scenario cards are conditions to watch, not predictions. Each one describes what a specific daily close beyond a level would mean for the chart's structure. None of them says that the move will happen; they help you read the chart if it does.
Recent changes and what followed
Each row is a day a tracked signal changed, and the price move over the next 5, 20 and 60 trading days (blank until that many days have passed). Past moves do not predict future ones.
| Date | Change | Close | Next 5 days | Next 20 days | Next 60 days |
|---|---|---|---|---|---|
| 2026-11-01 | MACD crossed above its signal line | ৳62.90 |
- Computed from daily closing prices (method t1, wording agent-2); history kept from 2026-11-01.
- Describes price history only. Not investment advice, not a rating or a price target.