BRAC Bank PLC. (BRACBANK) technical report
As of the 2026-11-01 close. Updated every trading day. Company page · All DSE stocks: technical data
In plain words
BRAC Bank's share price rose for about two years, from around ৳22.87 in early 2024 to a peak of ৳77.91 in late February 2026. After that peak it fell back and since March has moved sideways, mostly between ৳60.80 and ৳70.00. From a low of ৳61.50 in September, price climbed steadily through October and reached ৳68.90 on 25 October, just below the June highs of ৳69.70 and ৳70.00. It has since eased to ৳66.40. Two averages help frame this. The 50-day average, the average closing price of the last 50 trading days, is ৳64.44. The 200-day average, the average of the last 200 trading days, is ৳64.31. Both sit about ৳2 below the price and have almost met. The levels that matter are the ৳68.90–৳70.00 ceiling above, and ৳66.00, ৳64.30 and ৳60.80 below.
Key levels
Support is a price where falls have stopped before; resistance is where rises have stopped. For BRAC Bank, the zone ৳68.90–৳70.00 turned price back in June, at the end of June and again in late October. Below, ৳60.80–৳61.50 held in July, August and September, forming the floor of the range.
Trend on each timeframe
The monthly chart still shows a long rise, with price above its 12-month average. The weekly chart has flattened, its two averages now level and close together. The daily chart is a range with price in its upper half. The hourly chart has turned down over the last few sessions, so the shortest view is the weakest one.
Monthly Up
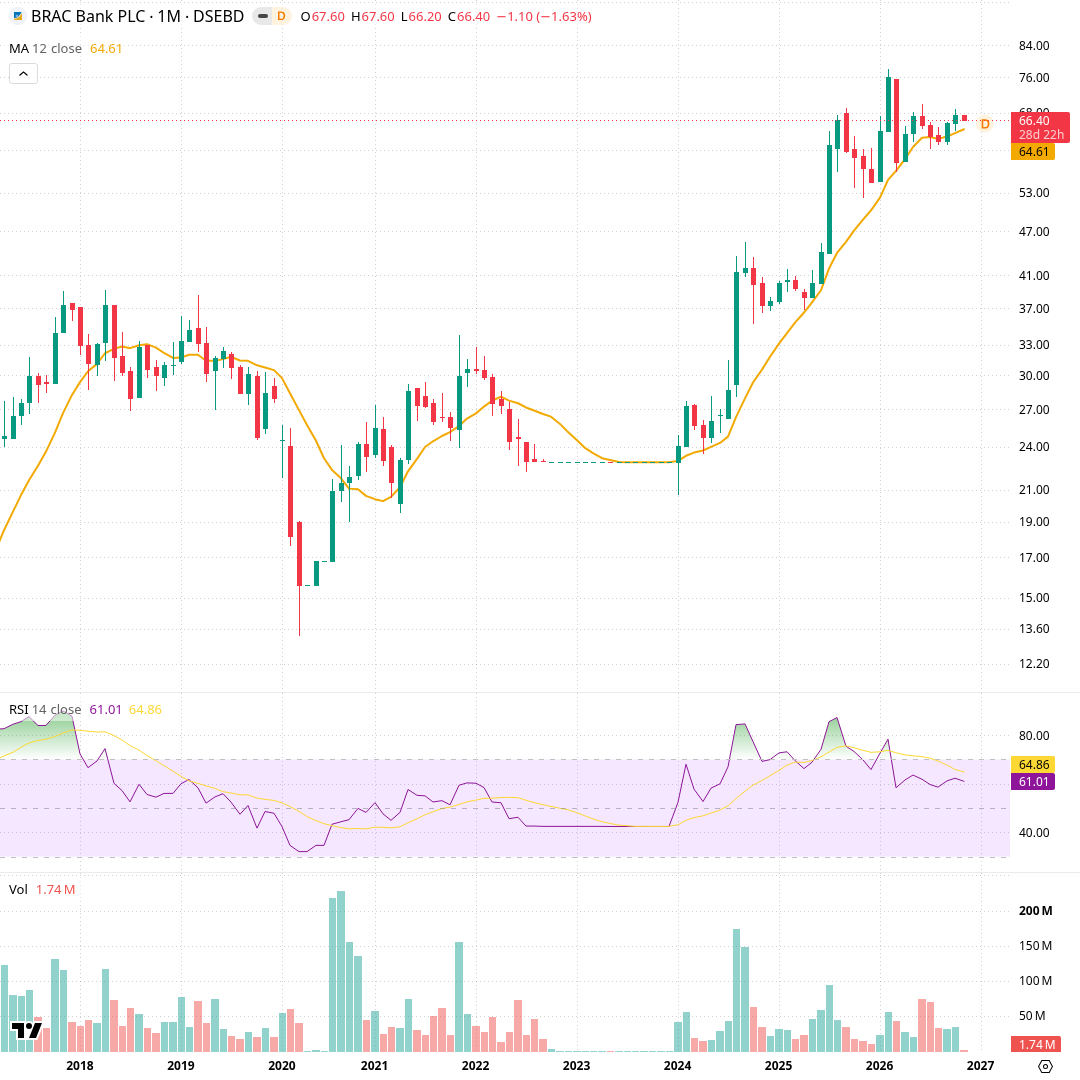
Each candle is one month, covering about nine years. The orange line is the 12-month average closing price; RSI below gauges strength from 0 to 100; volume is at the bottom. After a flat stretch near ৳22.87 in 2023, price rose through 2024 and 2025, peaking at ৳77.91 in February 2026. Since then it has moved sideways in the ৳60s, and the 12-month average has climbed to ৳64.61, just below today's ৳66.40. Monthly RSI is 61.0, off its earlier readings above 80.
Weekly Sideways
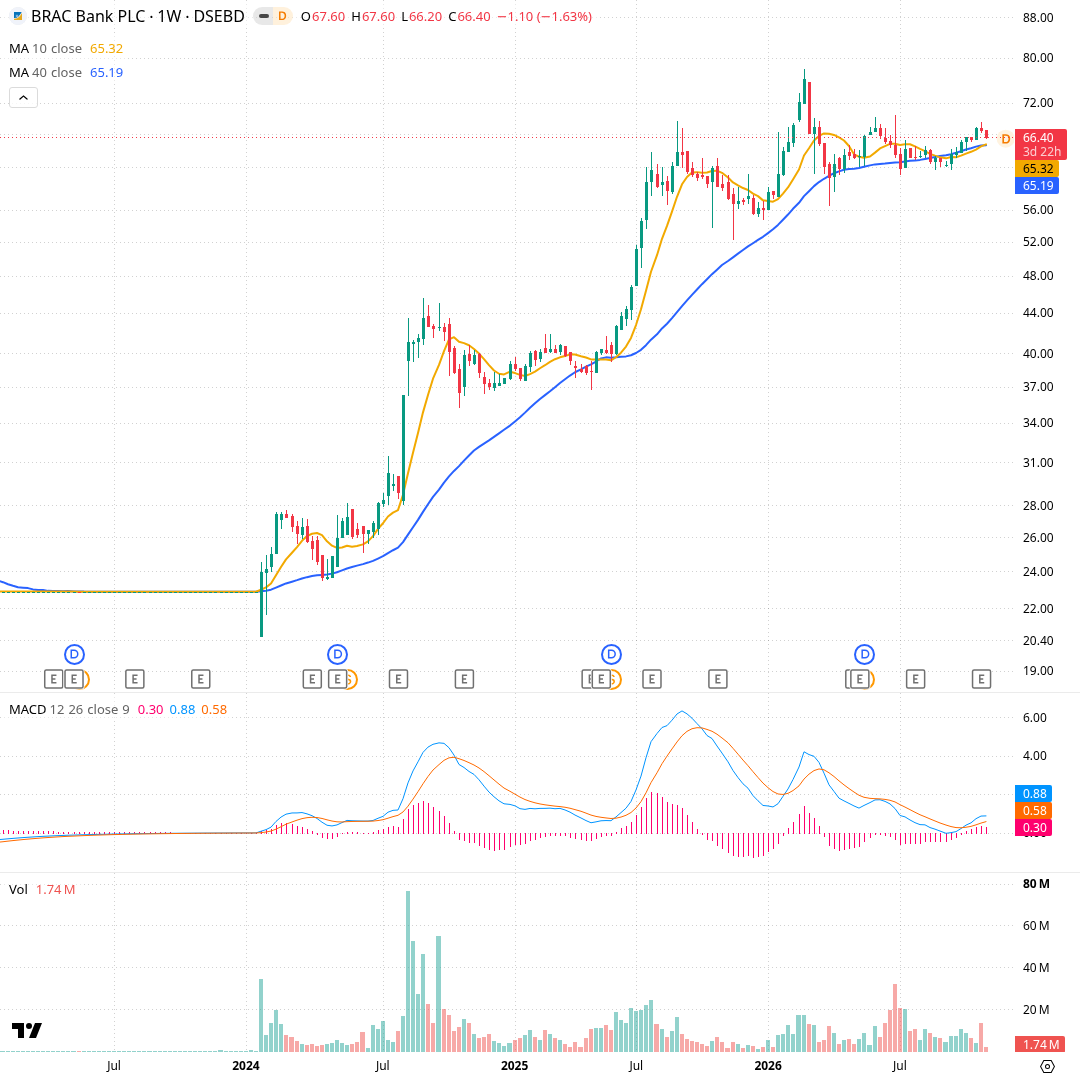
Each candle is one week over about four years. The orange line is the 10-week average and the blue line the 40-week average; MACD below compares a fast and a slow average to show momentum. Price climbed from about ৳22.87 in early 2024 to ৳77.91 in February 2026, then pulled back and moved sideways between ৳60.80 and ৳70.00. The two averages have converged at ৳65.32 and ৳65.19, with price ৳66.40 just above. MACD (0.88) has crossed back above its signal (0.58), its first positive gap since spring.
Daily Sideways
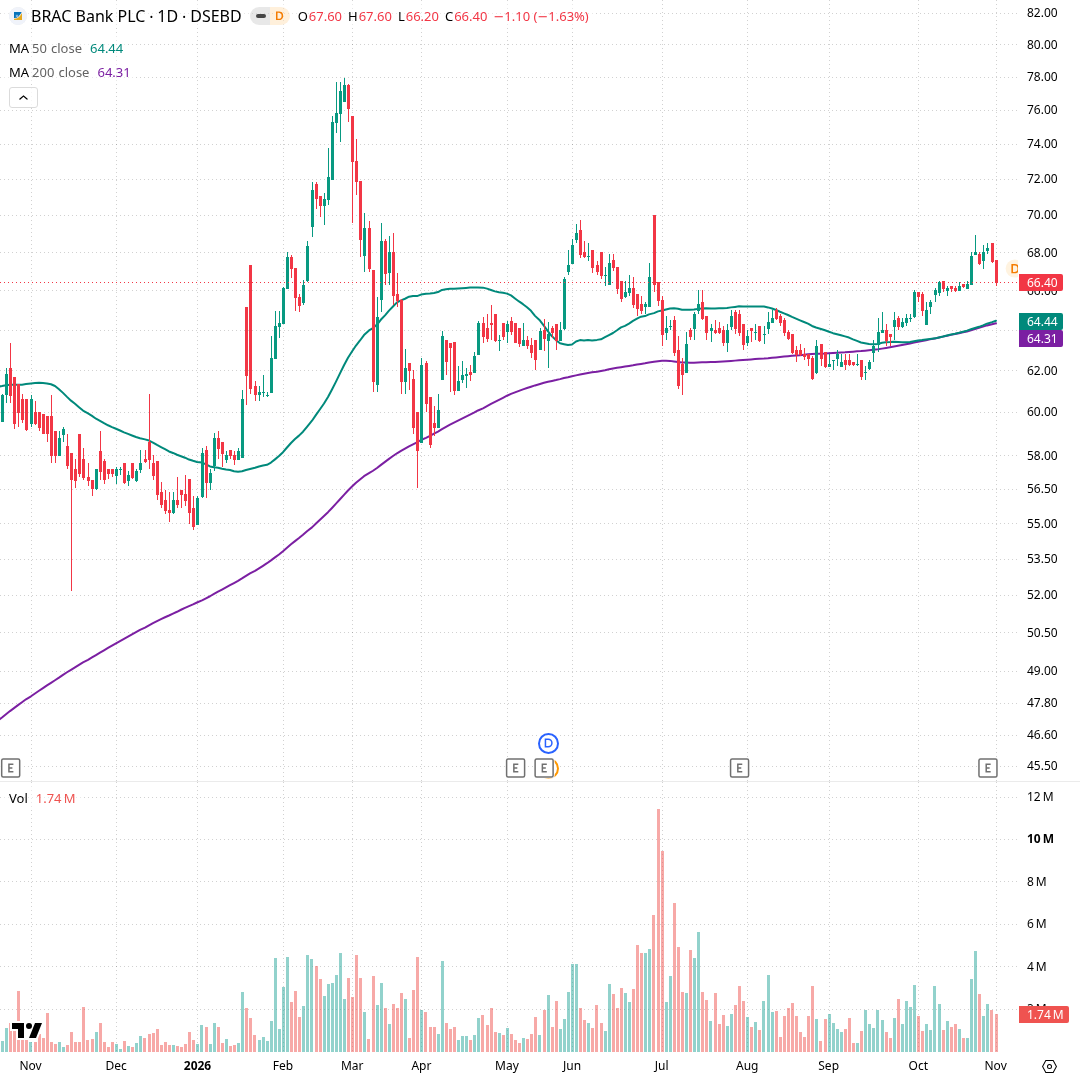
Each candle is one trading day over about a year. The green line is the 50-day average and the purple line the 200-day average, the average closing price of the last 200 trading days. Price ran from ৳54.87 in late December to ৳77.91 on 25 February, then fell back and has stayed between ৳60.80 (July) and ৳70.00 (June). From a ৳61.50 low in September it climbed steadily to ৳68.90 on 25 October and now sits at ৳66.40. The two averages have almost met at ৳64.44 and ৳64.31.
Hourly Down
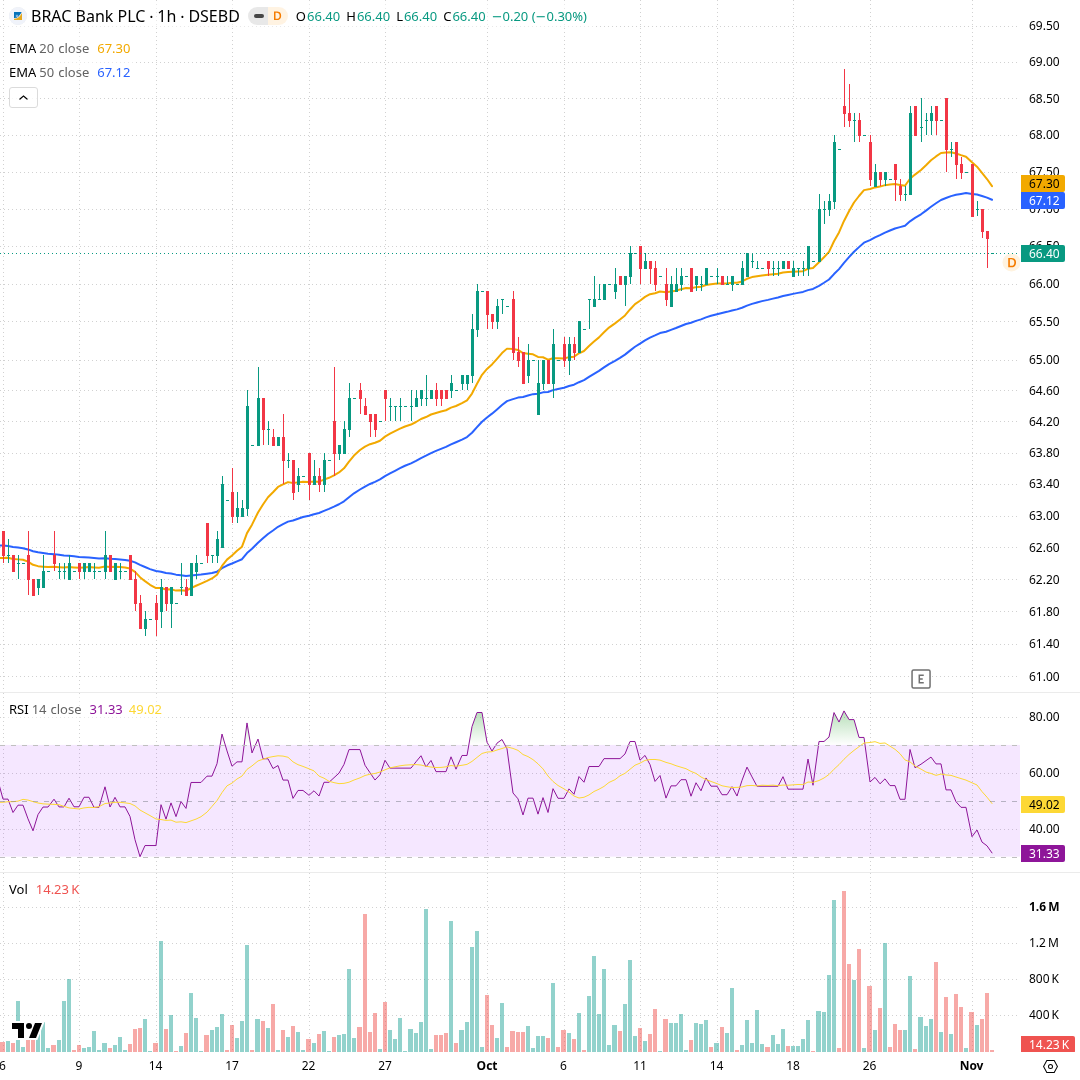
Each candle is one trading hour over about two months. The orange and blue lines are 20- and 50-hour exponential averages, which weight recent prices more; RSI is below. Price rose in a steady staircase from about ৳61.50 in mid-September to ৳68.90 on 25 October, staying above both averages throughout. In the last sessions it slipped from ৳68.50 to ৳66.40, falling under both averages (৳67.30 and ৳67.12). Hourly RSI is 31.3, its lowest reading in two months.
Momentum and volume
The October rally has cooled. RSI fell from near 77, a stretched reading, to a neutral 52.7, and MACD has just crossed under its signal line. ADX at 35.0 still shows a trend in place, with buyers' directional reading ahead of sellers'. Volume on the pullback is about average (0.98x), so selling has not been heavy.
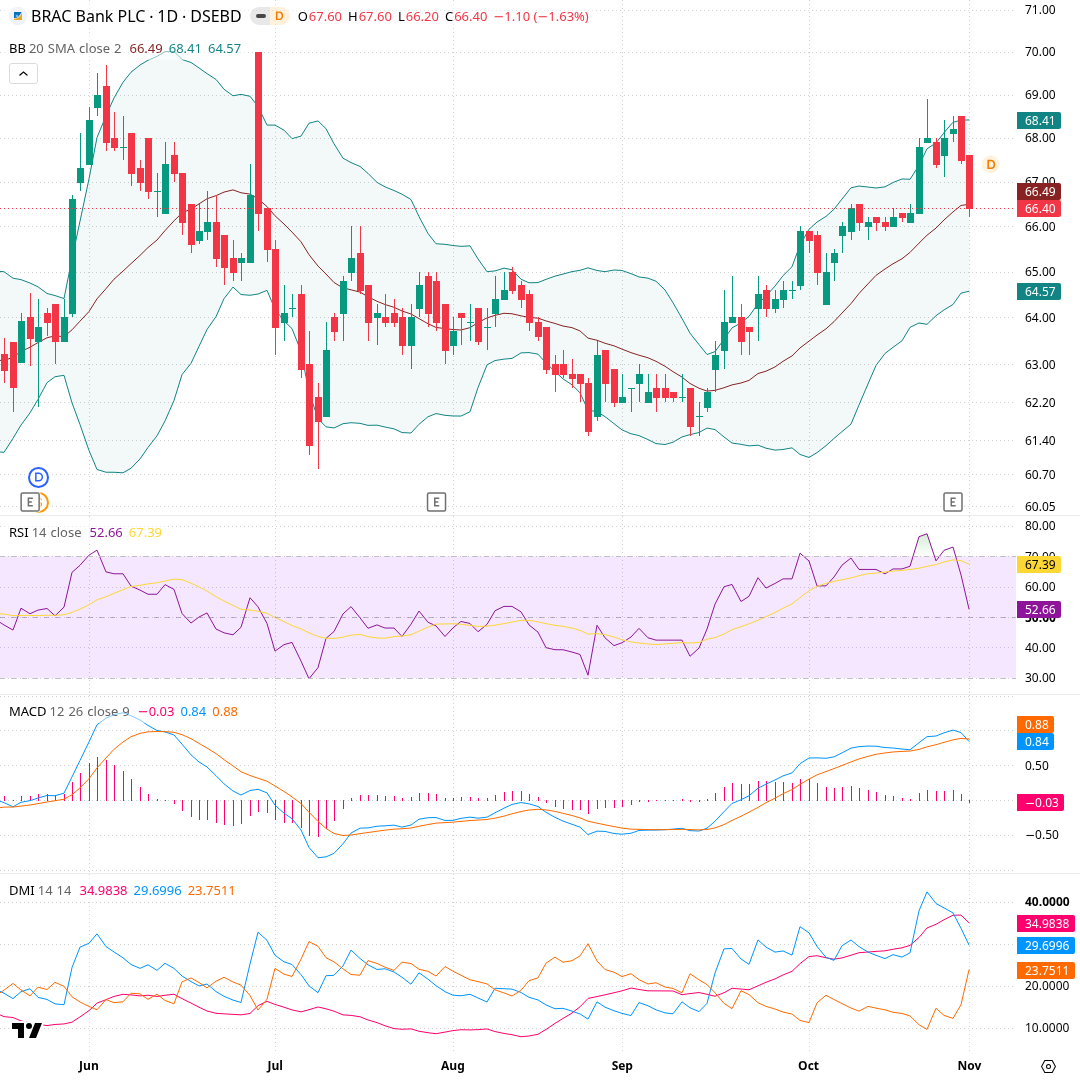
Each candle is one trading day over about six months. The shaded Bollinger Bands mark a typical range around the 20-day average (now ৳64.57 to ৳68.41). RSI gauges strength from 0 to 100, MACD tracks whether momentum is building or fading, and ADX/DMI shows trend strength and direction. Price rode the upper band from mid-September to a ৳68.90 high on 25 October, then fell back to the ৳66.49 middle band. RSI dropped from near 77 to 52.7, MACD slipped just under its signal, and ADX is 35.0 with +DI (29.7) above -DI (23.8).
What would change the picture
The scenario cards describe price conditions and what each would change in the chart's structure. They are not forecasts and do not say which will happen. They mark the levels where the current picture would shift, so a reader can later check which condition, if any, was met.
Recent changes and what followed
Each row is a day a tracked signal changed, and the price move over the next 5, 20 and 60 trading days (blank until that many days have passed). Past moves do not predict future ones.
| Date | Change | Close | Next 5 days | Next 20 days | Next 60 days |
|---|---|---|---|---|---|
| 2026-11-01 | MACD crossed below its signal line | ৳66.40 | |||
| 2026-10-29 | RSI fell back below 70 | ৳67.50 | |||
| 2026-10-27 | RSI rose to 70 or above | ৳68.00 | |||
| 2026-10-26 | RSI fell back below 70 | ৳67.40 | |||
| 2026-10-19 | RSI rose to 70 or above | ৳67.60 | +0.9% | ||
| 2026-10-01 | RSI fell back below 70 | ৳65.70 | +1.1% | ||
| 2026-09-30 | RSI rose to 70 or above | ৳65.90 | +0.2% | +0.8% | |
| 2026-09-16 | Trend label changed from Downtrend to Sideways | ৳63.20 | +2.1% | +4.4% | |
| 2026-09-15 | MACD crossed above its signal line | ৳62.40 | +2.1% | +5.9% | |
| 2026-09-13 | MACD crossed below its signal line | ৳61.70 | +3.7% | +7.1% | |
| 2026-09-06 | MACD crossed above its signal line | ৳62.40 | -1.1% | +4.2% | |
| 2026-08-19 | MACD crossed below its signal line | ৳62.80 | +0.6% | +1.8% | |
| 2026-08-16 | Trend label changed from Sideways to Downtrend | ৳63.90 | -1.9% | -3.1% | |
| 2026-08-11 | Trend label changed from Downtrend to Sideways | ৳64.60 | -2.6% | -3.6% | |
| 2026-07-14 | MACD crossed above its signal line | ৳64.80 | -1.4% | -0.3% | +2.5% |
| 2026-07-09 | RSI rose back above 30 | ৳61.80 | +4.5% | +3.2% | +5.2% |
| 2026-07-08 | RSI fell to 30 or below | ৳61.30 | +6.5% | +3.6% | +6.0% |
| 2026-07-05 | MACD crossed below its signal line | ৳64.10 | -1.2% | -0.6% | +0.8% |
| 2026-06-30 | Volume three times or more its 20-day average | ৳65.50 | -6.4% | -2.4% | -1.7% |
| 2026-06-28 | MACD crossed above its signal line | ৳66.70 | -3.7% | -3.0% | -3.3% |
| 2026-06-22 | MACD crossed below its signal line | ৳65.30 | +1.5% | -2.1% | -2.1% |
| 2026-06-07 | Trend label changed from Sideways to Downtrend | ৳67.80 | -0.6% | -5.3% | -7.8% |
| 2026-06-01 | MACD crossed above its signal line | ৳68.40 | -2.0% | -4.2% | -8.5% |
| 2026-05-27 | 50-day average crossed below the 200-day average | ৳67.30 | +0.9% | -3.0% | -7.0% |
| 2026-05-24 | RSI rose back above 30 | ৳67.30 | +0.0% | -3.0% | -6.7% |
| 2026-05-18 | Closed below the 200-day average | ৳63.80 | +5.5% | +3.6% | +0.9% |
| 2026-05-18 | MACD crossed below its signal line | ৳63.80 | +5.5% | +3.6% | +0.9% |
| 2026-05-18 | RSI fell to 30 or below | ৳63.80 | +5.5% | +3.6% | +0.9% |
| 2026-05-18 | Closed below the nearest support level | ৳63.80 | +5.5% | +3.6% | +0.9% |
| 2026-05-14 | Trend label changed from Uptrend to Sideways | ৳73.10 | -7.9% | -8.1% | -11.6% |
| 2026-05-13 | Trend label changed from Sideways to Uptrend | ৳73.50 | -12.9% | -8.3% | -12.1% |
| 2026-05-13 | MACD crossed above its signal line | ৳73.50 | -12.9% | -8.3% | -12.1% |
| 2026-05-12 | MACD crossed below its signal line | ৳71.90 | -11.7% | -7.1% | -10.4% |
| 2026-04-08 | MACD crossed above its signal line | ৳73.20 | -3.4% | -0.5% | -12.3% |
| 2026-04-08 | Closed above the nearest resistance level | ৳73.20 | -3.4% | -0.5% | -12.3% |
| 2026-04-07 | Closed above the 200-day average | ৳69.10 | +1.6% | +5.5% | -7.2% |
| 2026-04-05 | Closed below the 200-day average | ৳67.30 | +7.9% | +9.8% | -2.7% |
| 2026-04-02 | Closed below the nearest support level | ৳69.50 | +3.3% | +5.3% | -4.6% |
| 2026-04-01 | Closed above the 200-day average | ৳71.60 | +2.2% | +2.0% | -6.8% |
| 2026-04-01 | RSI rose back above 30 | ৳71.60 | +2.2% | +2.0% | -6.8% |
| 2026-04-01 | Closed above the nearest resistance level | ৳71.60 | +2.2% | +2.0% | -6.8% |
| 2026-03-31 | RSI fell to 30 or below | ৳67.00 | +3.1% | +9.0% | -2.5% |
| 2026-03-30 | Closed below the 200-day average | ৳68.20 | +0.0% | +8.4% | -4.7% |
| 2026-03-15 | Trend label changed from Uptrend to Sideways | ৳75.60 | -0.4% | -4.0% | -11.4% |
| 2026-03-10 | Trend label changed from Sideways to Uptrend | ৳78.90 | -4.6% | -12.4% | -13.9% |
| 2026-03-10 | Closed above the nearest resistance level | ৳78.90 | -4.6% | -12.4% | -13.9% |
| 2026-03-09 | Closed above the nearest resistance level | ৳74.30 | +1.3% | -8.2% | -7.1% |
| 2026-03-08 | Trend label changed from Uptrend to Sideways | ৳70.70 | +6.9% | -4.8% | -3.3% |
Signal history for this stock
How often the price was higher 20 trading days after each signal, on this stock, since our records start. Small counts mean little; costs are not included.
| Signal | Times | Higher after 20 days | Median move |
|---|---|---|---|
| MACD crossed above its signal line | 16 | 44% | -0.3% |
| MACD crossed below its signal line | 15 | 47% | -0.6% |
| RSI rose to 70 or above | 9 | 67% | +0.8% |
| Closed below the nearest support level | 8 | 62% | +3.6% |
| RSI fell back below 70 | 8 | 50% | +1.7% |
| New 52-week closing high | 8 | 62% | +2.3% |
| Closed above the nearest resistance level | 7 | 43% | -0.5% |
| Closed below the 200-day average | 6 | 83% | +9.4% |
| RSI rose back above 30 | 5 | 80% | +3.2% |
| RSI fell to 30 or below | 5 | 100% | +5.9% |
| Closed above the 200-day average | 5 | 80% | +5.5% |
| 50-day average crossed below the 200-day average | 2 | 50% | +22.0% |
| 50-day average crossed above the 200-day average | 1 | 100% | +18.6% |
- Computed from daily closing prices (method t1, wording agent-2); history kept from 2024-10-08.
- Describes price history only. Not investment advice, not a rating or a price target.