Best Holdings PLC. (BESTHLDNG) technical report
As of the 2026-11-01 close. Updated every trading day. Company page · All DSE stocks: technical data
In plain words
Best Holdings has been weak for most of its time on the market, falling from about ৳33 in 2024 to ৳10.90 in January 2026. It then recovered to ৳16.70 by July, but since August it has been sliding again. On 1 November it fell 3.01% to ৳12.90, its lowest close since May. The price is now below its 50-day average (the average closing price of the last 50 trading days, ৳14.40) and its 200-day average (the average of the last 200 days, ৳13.85). Falling under the 200-day average is often read as a sign the longer-term trend has turned down. The next level below is ৳12.40–12.50, where the stock repeatedly found buyers in March to May. Above, ৳13.85 and ৳14.40 are the levels it would need to get back over to repair the damage.
Key levels
Support is a price where buying has stopped a fall; resistance is where selling has stopped a rise. Best Holdings bounced several times at ৳12.40–12.50 in spring, so that is the first support. Above, the 200-day average at ৳13.85 has just turned from support into resistance, with the 50-day at ৳14.40 above it.
Trend on each timeframe
All four views point the same way. Monthly and weekly charts show the July rebound fading and price falling under their averages. The daily chart shows a break under the 200-day line, and the hourly chart shows steady lower highs since mid-October. There is little disagreement between horizons.
Monthly Down
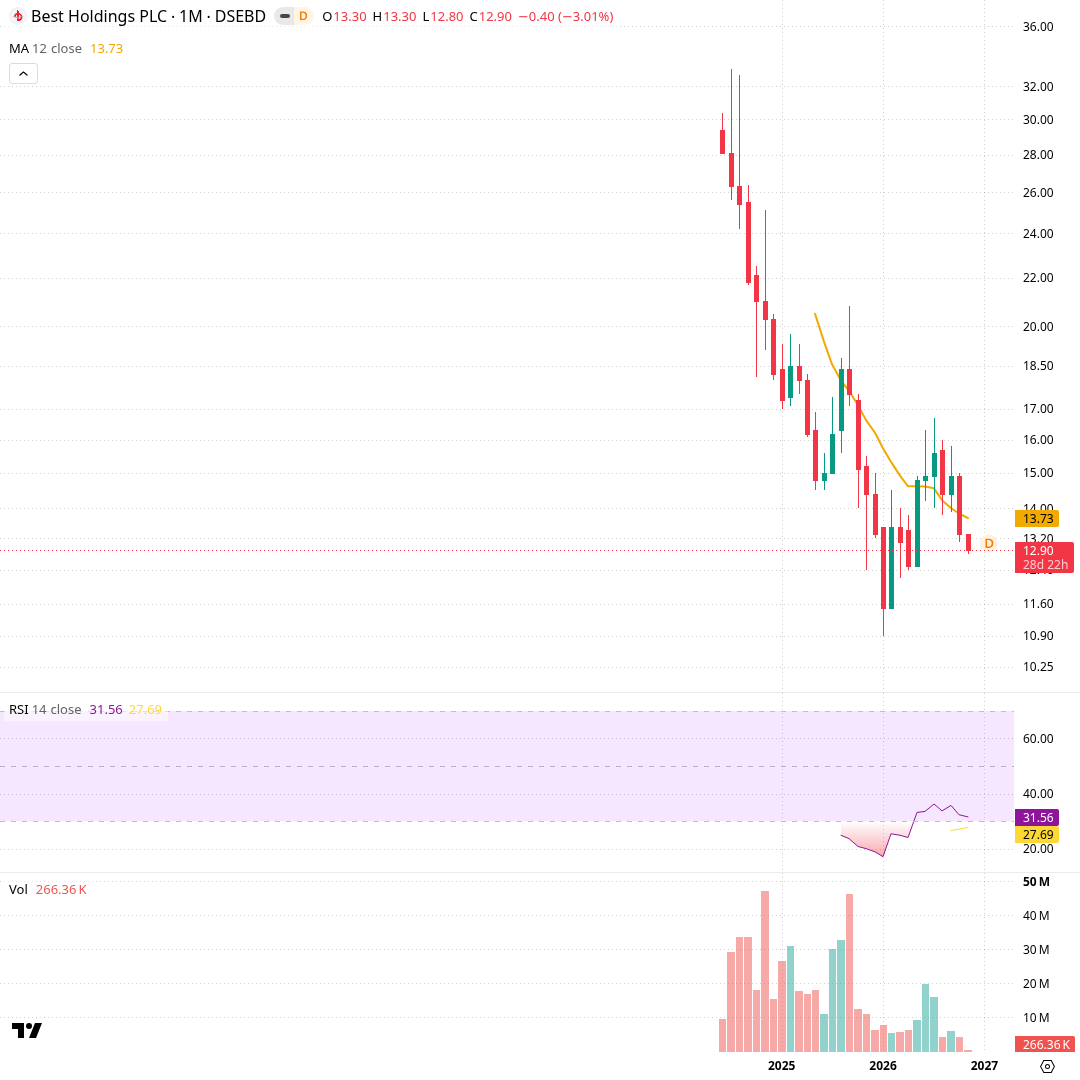
Each candle is one month since the stock's mid-2024 listing. The orange line is the 12-month average close, the RSI panel a 0–100 momentum gauge, and volume is shown at the bottom. Price fell from a ৳33.10 high in July 2024 to ৳10.90 in January 2026, with heavy volume during the early selling. A rebound reached ৳16.70 in July 2026, then August to October closed lower, ending October at ৳13.30. November opened at ৳12.90, below the 12-month average of ৳13.73; monthly RSI is 31.6.
Weekly Down
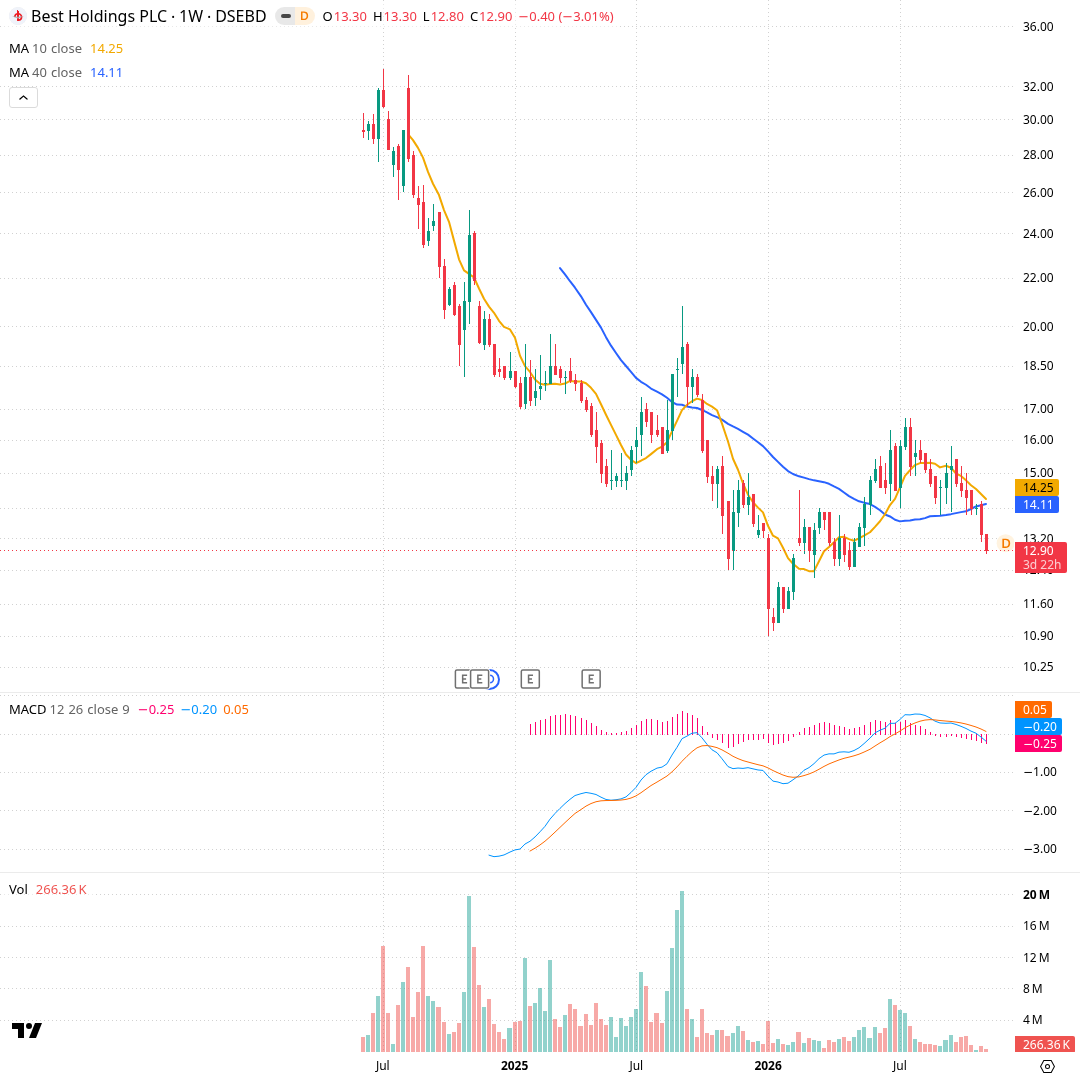
Each candle is one week over about two and a half years. The orange line is the 10-week average close and the blue line the 40-week average. The MACD panel tracks momentum. After the long 2024–2025 slide, price formed a base near ৳11–13 early in 2026 and rose above both averages by June. Since July the weekly candles have leaned red, and the last two weeks broke below both averages (৳14.25 and ৳14.11). MACD (-0.20) is under its signal (0.05). Weekly volume has been light, mostly below 4 million shares.
Daily Down
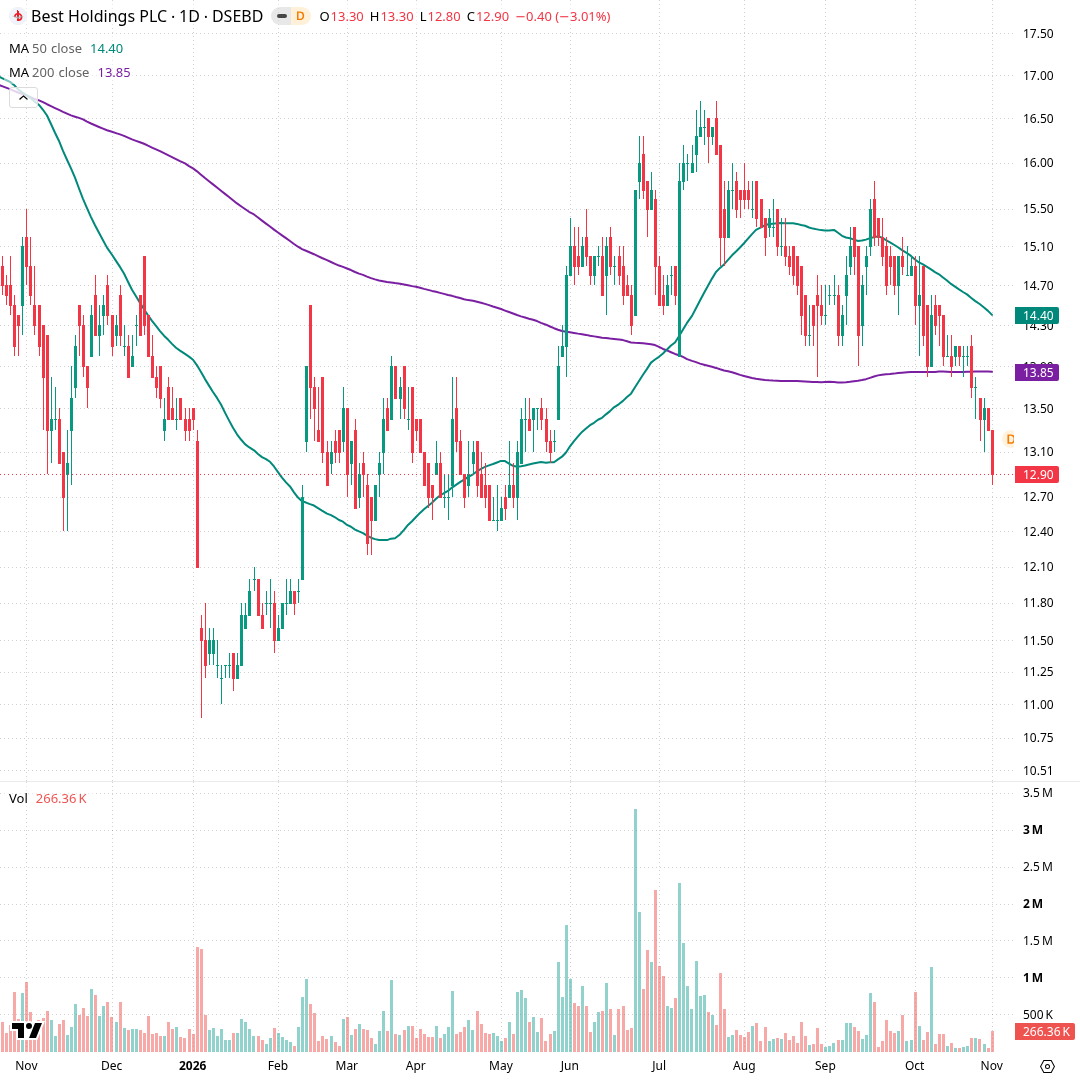
Each candle is one trading day over about a year. The green line is the 50-day average close and the purple line the 200-day average. Price dropped to ৳10.90 in January, ranged ৳12.40–14.00 from February to May, then rallied above both averages to ৳16.70 in July on volume spikes over 3 million shares. From August, highs fell (৳15.80 in September), and in late October price slipped under the 200-day average (৳13.85). It closed at ৳12.90 on 1 November, down 3.01%, on 266,356 shares.
Hourly Down
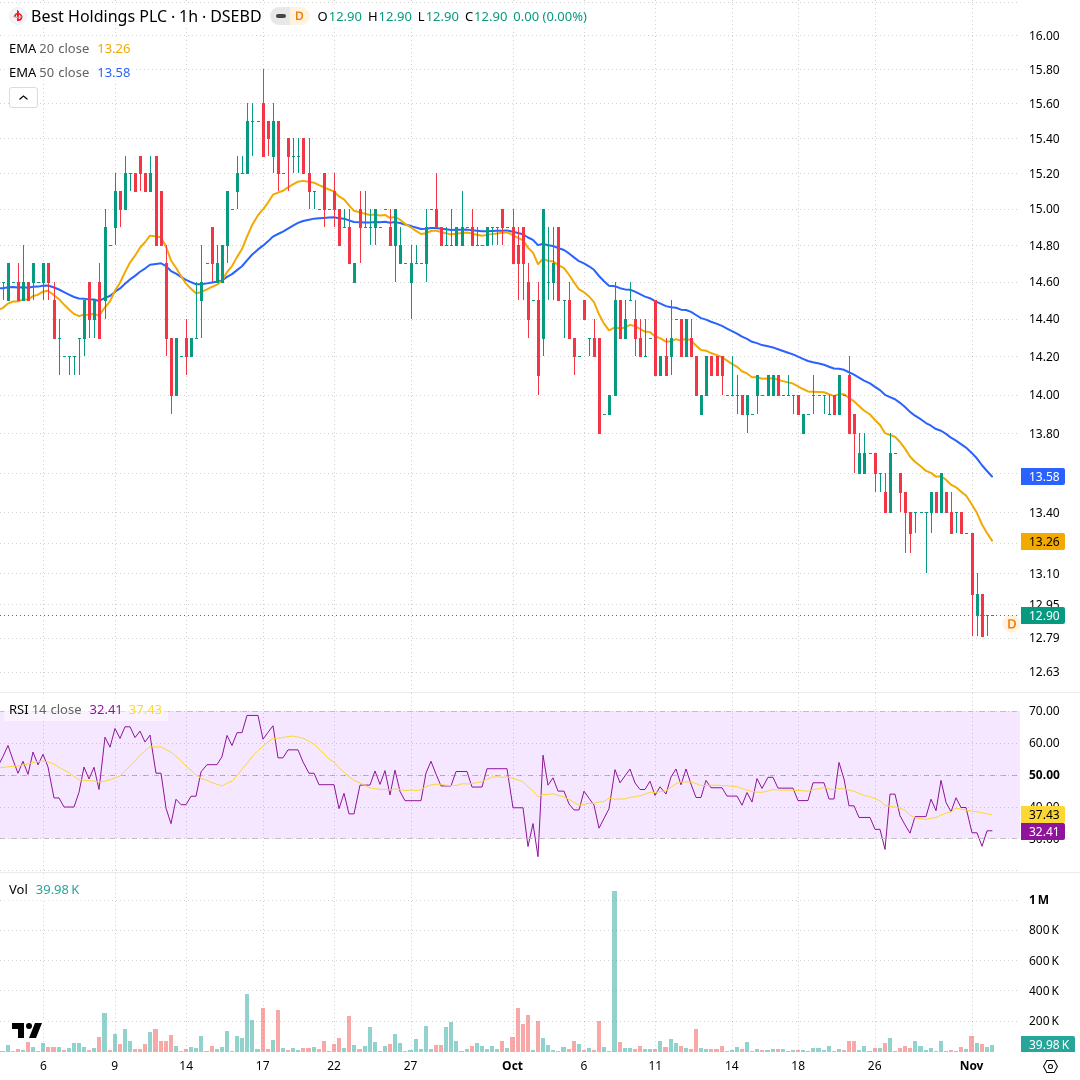
Each candle is one trading hour over about two months. The orange and blue lines are 20- and 50-hour exponential averages, which give more weight to recent prices. Price peaked near ৳15.80 in mid-September, held around ৳14.80–15.00 into early October, then stepped lower with both averages sloping down. It reached ৳12.80 on 1 November and trades at ৳12.90, under the 20-hour (৳13.26) and 50-hour (৳13.58) lines. Hourly RSI is 32.4 and volume has been thin, apart from one spike near 1 million in early October.
Momentum and volume
Sellers are clearly in charge right now. RSI below 28 means the drop has been fast enough to look stretched, and the close under the lower Bollinger band says the same. ADX near 47 shows a strong trend, almost entirely to the downside. Volume was only slightly above normal.
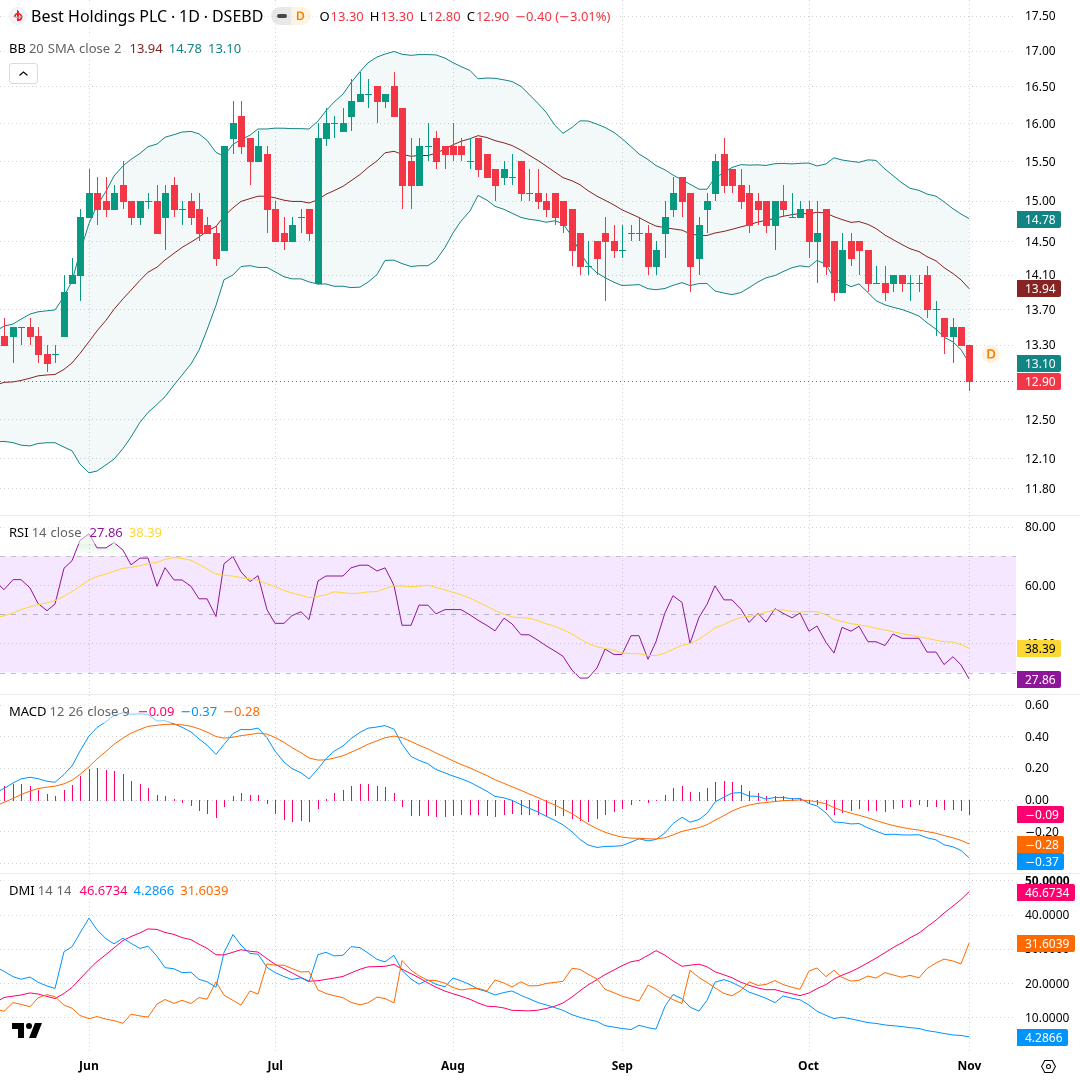
Each candle is one day over about six months. Bollinger Bands form a channel two standard deviations around the 20-day average; RSI, MACD and ADX/DMI panels are below. Price rode the upper band to ৳16.70 in July, then drifted down inside the bands. In late October it pressed along the lower band and on 1 November closed at ৳12.90, below it (৳13.10). RSI fell to 27.9, MACD (-0.37) is under its signal (-0.28), and ADX climbed to 46.7 with -DI at 31.6 against +DI at 4.3.
What would change the picture
The scenario cards describe conditions to watch, not forecasts. Each one explains what a specific daily close, such as losing ৳12.40 or regaining ৳13.85, would change about the chart's structure. They do not say which outcome is more likely.
Recent changes and what followed
Each row is a day a tracked signal changed, and the price move over the next 5, 20 and 60 trading days (blank until that many days have passed). Past moves do not predict future ones.
| Date | Change | Close | Next 5 days | Next 20 days | Next 60 days |
|---|---|---|---|---|---|
| 2026-11-01 | RSI fell to 30 or below | ৳12.90 | |||
| 2026-11-01 | Closed below the nearest support level | ৳12.90 |
- Computed from daily closing prices (method t1, wording agent-2); history kept from 2026-11-01.
- Describes price history only. Not investment advice, not a rating or a price target.