British American Tobacco Bangladesh Company Limited (BATBC) technical report
As of the 2026-11-01 close. Updated every trading day. Company page · All DSE stocks: technical data
In plain words
BAT Bangladesh has been in a long decline: it traded around ৳518.7 in 2023 and has fallen in steps since 2024. This year it rallied to ৳292.9 in February, dropped to about ৳208 in March, and recovered to ৳256.8 in late July before sliding again. Through October the price sat quietly between about ৳217 and ৳221. Over the last two sessions it fell sharply, closing today at ৳201.10, down 3.83%, a new 52-week low and 31.3% under the year's high. It is below its 50-day average (the average closing price of the last 50 trading days, ৳225.90) and its 200-day average (the average of the last 200 trading days, ৳232.53), and both are falling. The levels that matter now are the ৳205.8–৳207.9 zone that used to be the floor, the ৳217–৳221 October range above, and today's low of ৳200.9.
Key levels
Support is where buying has halted falls; resistance is where selling has halted rises. For BATBC, ৳207.9 (March) and ৳205.8 (June) were the floors of 2026, and price just closed beneath them. Old floors often act as ceilings after a break. Above, ৳217–৳221 held all of October, and ৳256.8 is where the summer rally ended.
Trend on each timeframe
All four views point the same way. The monthly shows lower highs since 2021, the weekly shows price under both falling averages, the daily shows a fresh break below the year's lows, and the hourly shows a steep gap down. The only disagreement is that the hourly and daily readings are stretched very low.
Monthly Down
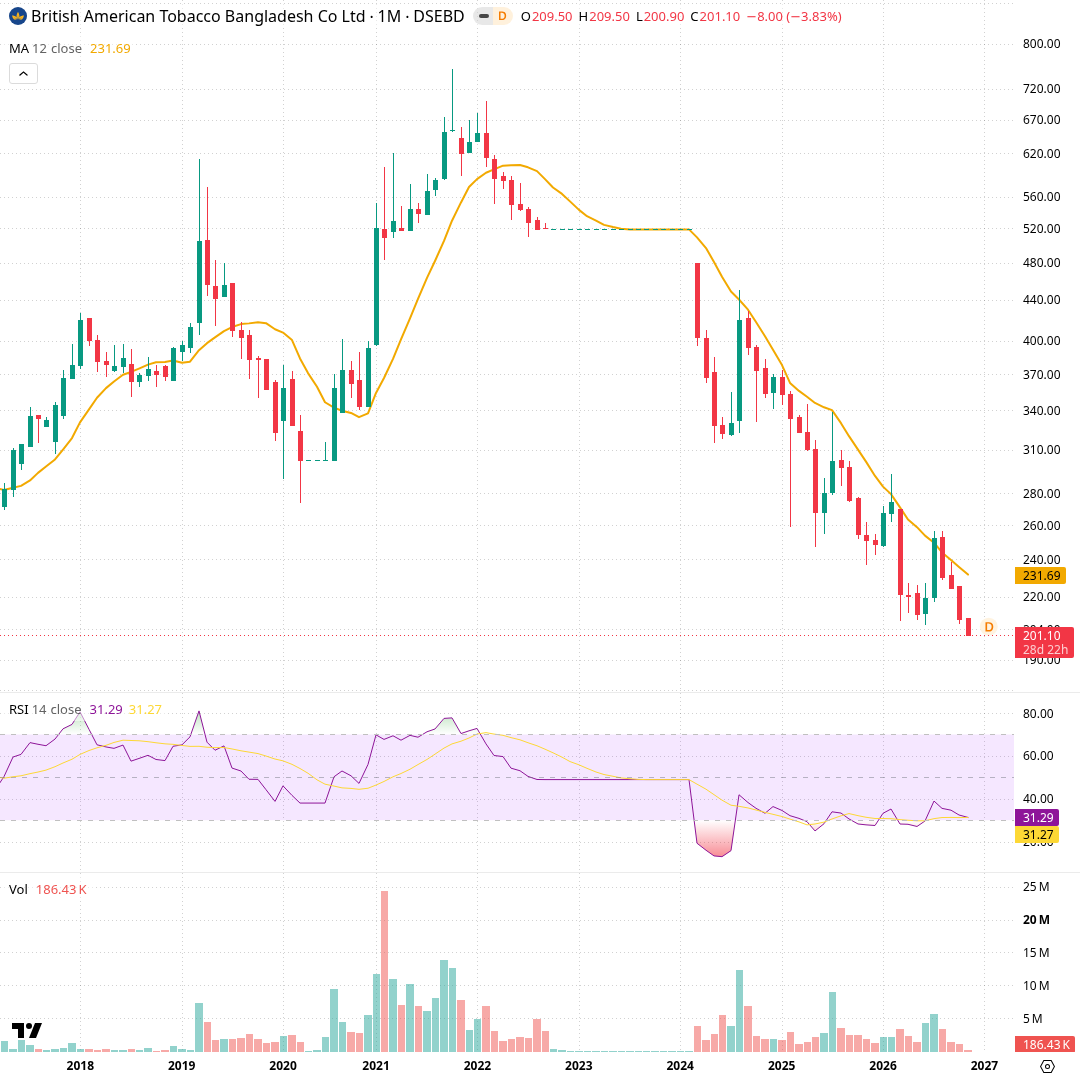
Each candle is one month, from about 2017 to now. The orange line is the 12-month simple average (৳231.69), the middle panel is RSI 14 (31.3) and the bottom panel monthly volume. The stock peaked near ৳720 in late 2021, held at ৳518.7 through 2023, then fell steadily from 2024. Rallies in mid-2024, early 2026 (to ৳292.9) and July-August 2026 (to ৳256.8) each topped lower. November opened at ৳209.5 and is at ৳201.1, the lowest on this chart, below the 12-month average.
Weekly Down
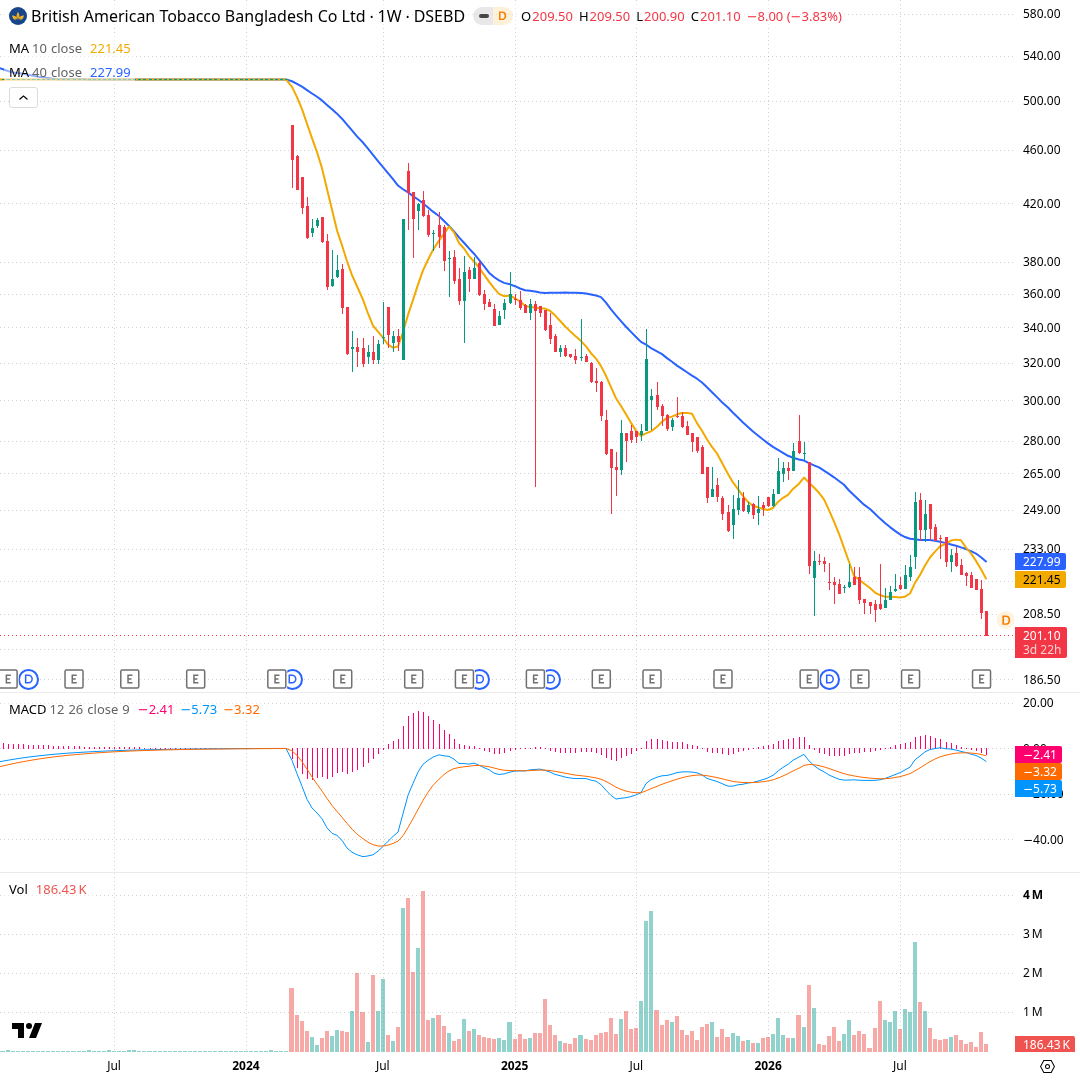
Each candle is one week. The orange line is the 10-week average (৳221.45), the blue line the 40-week average (৳227.99); the MACD panel shows momentum (line -5.73 vs signal -3.32) and the bottom panel weekly volume. A late-July week jumped to ৳256.8 on 2.79 million shares, but closes since have slid from ৳252.3 to ৳201.1 over thirteen weeks. Last week dropped to ৳209.1 on 496,293 shares and this week opened lower at ৳201.1. Both averages are falling and price is under them.
Daily Down
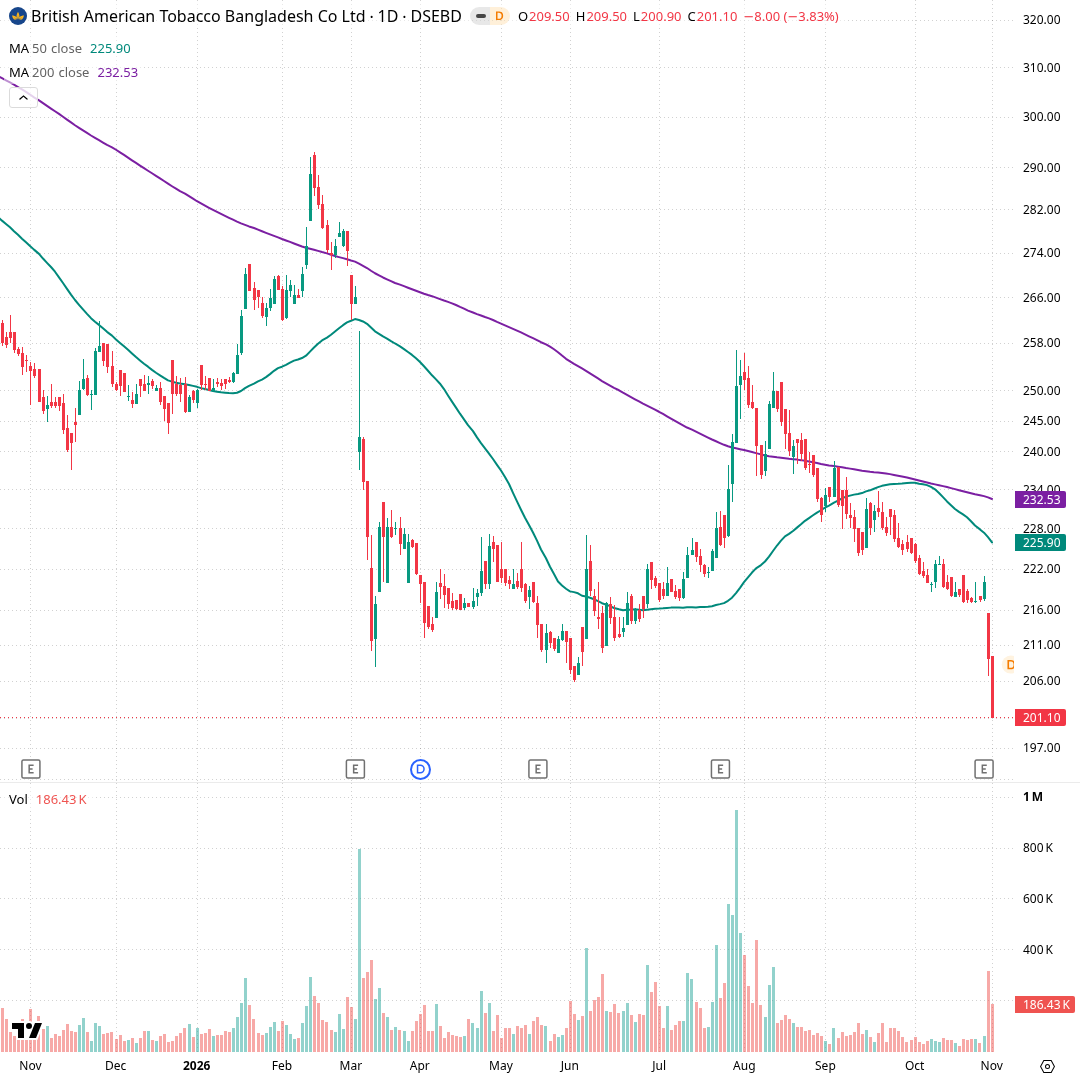
Each candle is one trading day, about the last year. The green line is the 50-day average (৳225.90), the purple the 200-day average (৳232.53), and the bottom panel daily volume. Price fell from ৳292.9 in February to ৳207.9 in March, bounced, and then made a low at ৳205.8 in early June. A July rally reached ৳256.8 but faded through September and October to around ৳217–৳220. On 29 October price dropped to ৳209.1 on 314,258 shares and today to ৳201.1 on 186,433 shares, breaking under the earlier lows.
Hourly Down
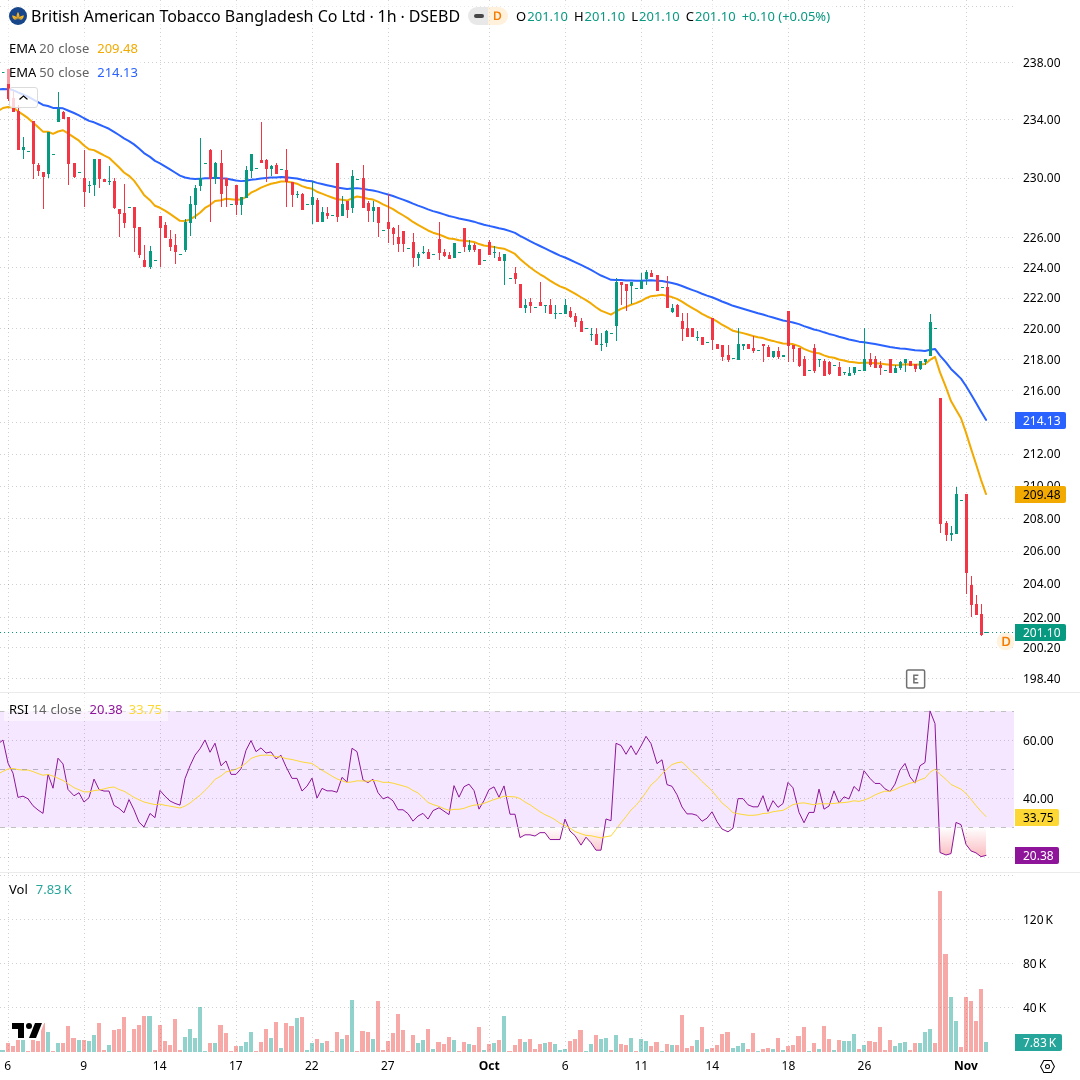
Each candle is one trading hour, from early September to 1 November. The orange line is the 20-hour exponential average (৳209.48), the blue the 50-hour (৳214.13); below are RSI 14 (20.4) and hourly volume. Price drifted from about ৳234 to ৳217 through September and October in a slow, orderly decline under both averages. In the last two sessions it gapped down to about ৳207 with the largest hourly volumes on this chart, briefly bounced to ৳210, then slid to ৳201.1.
Momentum and volume
Selling has been heavy and one-sided. RSI at 19 is in oversold territory, meaning the fall has been unusually fast. MACD has turned further negative and the selling-pressure line is well above the buying line. Volume was about three times normal, so the break had real participation rather than being a thin-market print.
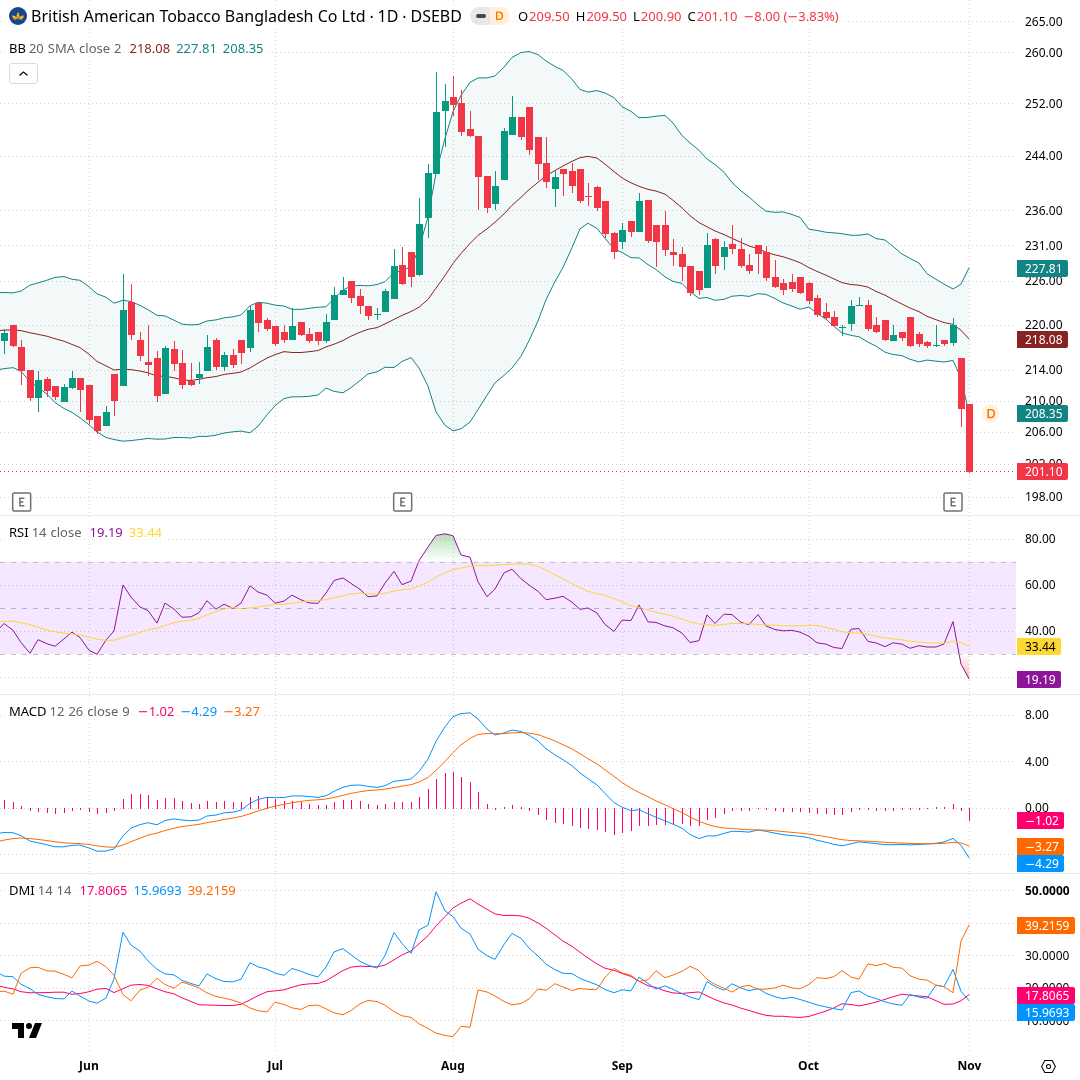
Each candle is one trading day from late May to 1 November. The Bollinger Bands show a 20-day average (৳218.08) with bands at ৳227.81 and ৳208.35. Through October the bands squeezed tight as price drifted near ৳217–৳220; the last two candles broke out below the lower band to ৳201.1. RSI 14 fell from about 45 to 19.2, its lowest in the window. MACD dropped to -4.29, below its signal at -3.27. In the DMI panel, the selling line (-DI) jumped to 39.2 while the buying line sits at 16.0, and ADX is 17.8.
What would change the picture
The scenario cards describe what a given closing price would mean for the chart's structure. They are conditions to watch, not predictions; they show which pattern would change if price reached each level.
Recent changes and what followed
Each row is a day a tracked signal changed, and the price move over the next 5, 20 and 60 trading days (blank until that many days have passed). Past moves do not predict future ones.
| Date | Change | Close | Next 5 days | Next 20 days | Next 60 days |
|---|---|---|---|---|---|
| 2026-11-01 | New 52-week closing low | ৳201.10 | |||
| 2026-10-29 | MACD crossed below its signal line | ৳209.10 | |||
| 2026-10-29 | RSI fell to 30 or below | ৳209.10 | |||
| 2026-10-29 | Volume three times or more its 20-day average | ৳209.10 | |||
| 2026-10-26 | MACD crossed above its signal line | ৳217.30 | |||
| 2026-10-19 | Trend label changed from Sideways to Downtrend | ৳217.50 | +1.1% | ||
| 2026-10-11 | 50-day average crossed below the 200-day average | ৳222.70 | -2.4% | ||
| 2026-09-27 | 50-day average crossed above the 200-day average | ৳225.30 | -1.7% | -3.4% | |
| 2026-09-15 | Trend label changed from Downtrend to Sideways | ৳231.00 | -1.5% | -5.2% | |
| 2026-09-08 | Trend label changed from Sideways to Downtrend | ৳230.40 | +0.3% | -4.5% | |
| 2026-09-06 | Closed below the 200-day average | ৳231.80 | -3.1% | -4.5% | |
| 2026-09-03 | Closed above the 200-day average | ৳237.30 | -3.9% | -5.9% | |
| 2026-08-27 | Closed below the 200-day average | ৳236.40 | +0.4% | -4.2% | |
| 2026-08-16 | MACD crossed below its signal line | ৳245.00 | -2.2% | -8.2% | |
| 2026-08-11 | MACD crossed above its signal line | ৳247.70 | -3.0% | -7.2% | |
| 2026-08-10 | Closed above the 200-day average | ৳239.60 | +1.4% | -3.8% | |
| 2026-08-10 | MACD crossed below its signal line | ৳239.60 | +1.4% | -3.8% | |
| 2026-08-09 | Closed below the 200-day average | ৳236.40 | +3.6% | -2.0% | |
| 2026-08-06 | RSI fell back below 70 | ৳241.00 | +2.5% | -3.8% | |
| 2026-07-29 | Volume three times or more its 20-day average | ৳250.70 | -3.9% | -7.2% | -13.2% |
| 2026-07-28 | Closed above the 200-day average | ৳241.50 | +2.4% | -2.1% | -10.0% |
| 2026-07-27 | RSI rose to 70 or above | ৳234.00 | +5.9% | +1.7% | -7.1% |
| 2026-06-28 | Closed above the nearest resistance level | ৳222.00 | -1.0% | +5.4% | +3.6% |
| 2026-06-21 | Trend label changed from Downtrend to Sideways | ৳217.00 | +2.3% | +2.1% | +5.2% |
| 2026-06-16 | Trend label changed from Sideways to Downtrend | ৳212.10 | +1.8% | +5.5% | +5.8% |
| 2026-06-14 | Trend label changed from Downtrend to Sideways | ৳216.90 | +0.0% | +3.3% | +5.9% |
| 2026-06-11 | Trend label changed from Sideways to Downtrend | ৳210.70 | +1.3% | +4.6% | +9.3% |
| 2026-06-07 | Trend label changed from Downtrend to Sideways | ৳222.00 | -2.3% | -1.0% | +5.0% |
| 2026-06-07 | MACD crossed above its signal line | ৳222.00 | -2.3% | -1.0% | +5.0% |
| 2026-06-07 | Closed above the nearest resistance level | ৳222.00 | -2.3% | -1.0% | +5.0% |
| 2026-06-07 | Volume three times or more its 20-day average | ৳222.00 | -2.3% | -1.0% | +5.0% |
| 2026-06-03 | RSI rose back above 30 | ৳208.50 | +1.1% | +4.6% | +11.8% |
| 2026-06-01 | MACD crossed below its signal line | ৳207.60 | +4.0% | +5.8% | +12.1% |
| 2026-06-01 | RSI fell to 30 or below | ৳207.60 | +4.0% | +5.8% | +12.1% |
| 2026-06-01 | New 52-week closing low | ৳207.60 | +4.0% | +5.8% | +12.1% |
| 2026-05-31 | MACD crossed above its signal line | ৳211.50 | +3.5% | +4.2% | +11.8% |
| 2026-05-18 | RSI rose back above 30 | ৳212.70 | -0.6% | -0.3% | +16.1% |
| 2026-05-17 | RSI fell to 30 or below | ৳210.40 | +0.5% | +2.1% | +18.8% |
| 2026-05-17 | New 52-week closing low | ৳210.40 | +0.5% | +2.1% | +18.8% |
| 2026-05-14 | MACD crossed below its signal line | ৳214.00 | -1.0% | +1.4% | +15.7% |
| 2026-04-08 | MACD crossed above its signal line | ৳218.50 | -1.0% | +0.5% | -0.2% |
| 2026-04-08 | RSI rose back above 30 | ৳218.50 | -1.0% | +0.5% | -0.2% |
| 2026-04-07 | MACD crossed below its signal line | ৳213.20 | +1.8% | +3.1% | +2.0% |
| 2026-03-31 | RSI fell to 30 or below | ৳221.30 | -1.3% | +1.7% | -2.3% |
| 2026-03-23 | MACD crossed above its signal line | ৳228.00 | -1.2% | -5.0% | -6.9% |
| 2026-03-10 | RSI rose back above 30 | ৳228.20 | -0.1% | -4.3% | -8.6% |
| 2026-03-04 | New 52-week closing low | ৳235.30 | -3.6% | -6.5% | -10.1% |
| 2026-03-04 | Closed below the nearest support level | ৳235.30 | -3.6% | -6.5% | -10.1% |
| 2026-03-03 | Trend label changed from Sideways to Downtrend | ৳242.30 | -5.8% | -8.7% | -12.7% |
| 2026-03-03 | RSI fell to 30 or below | ৳242.30 | -5.8% | -8.7% | -12.7% |
| 2026-03-03 | Closed below the nearest support level | ৳242.30 | -5.8% | -8.7% | -12.7% |
| 2026-03-03 | Volume three times or more its 20-day average | ৳242.30 | -5.8% | -8.7% | -12.7% |
| 2026-03-01 | Closed below the 200-day average | ৳264.90 | -20.1% | -14.6% | -20.2% |
| 2026-02-23 | Closed above the 200-day average | ৳276.50 | -3.8% | -17.5% | -23.5% |
Signal history for this stock
How often the price was higher 20 trading days after each signal, on this stock, since our records start. Small counts mean little; costs are not included.
| Signal | Times | Higher after 20 days | Median move |
|---|---|---|---|
| MACD crossed below its signal line | 16 | 38% | -0.9% |
| MACD crossed above its signal line | 16 | 38% | -2.5% |
| RSI rose back above 30 | 15 | 40% | -0.4% |
| RSI fell to 30 or below | 15 | 47% | -0.3% |
| New 52-week closing low | 9 | 33% | -3.6% |
| Closed below the 200-day average | 5 | 0% | -4.5% |
| Closed above the 200-day average | 5 | 0% | -5.9% |
| RSI fell back below 70 | 5 | 40% | -2.3% |
| RSI rose to 70 or above | 5 | 60% | +1.7% |
| Closed above the nearest resistance level | 4 | 50% | +5.4% |
| Closed below the nearest support level | 2 | 0% | -6.5% |
| 50-day average crossed above the 200-day average | 1 | 0% | -3.4% |
- Computed from daily closing prices (method t1, wording agent-2); history kept from 2024-10-08.
- Describes price history only. Not investment advice, not a rating or a price target.